


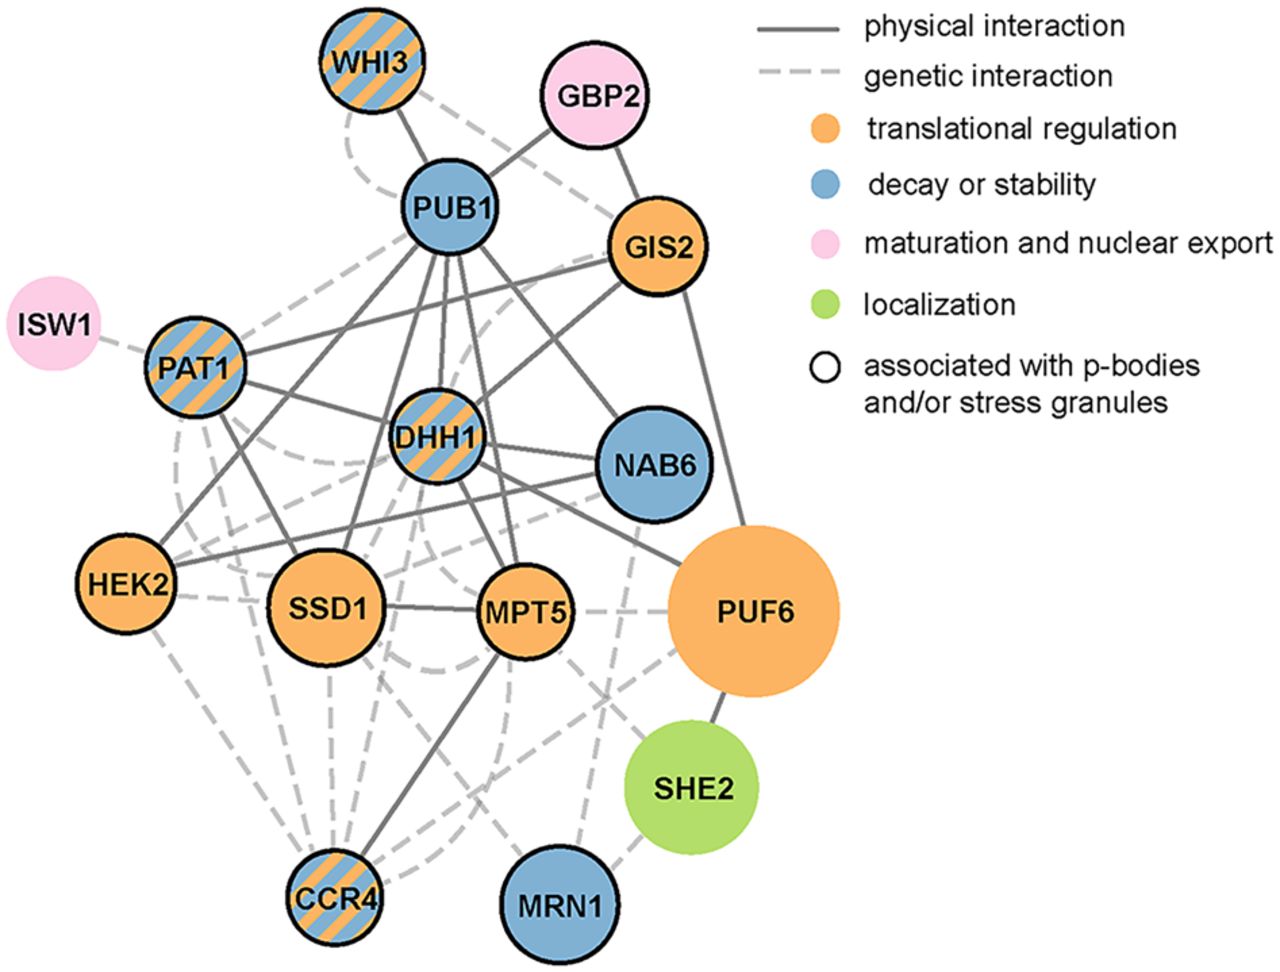
FIGURE 3.
Ssd1 shares a regulatory network with 14 other RBPs. Each circle represents an RBP and each line represents a physical or genetic interaction according to the key. With the exception of Ssd1, nodes are scaled to reflect the proportion of that RBP's targets that are also bound by Ssd1. Colors depict the primary functional groups of each RBP as shown; since many RBPs are involved in multiple functions, this figure depicts simplified annotations.




