


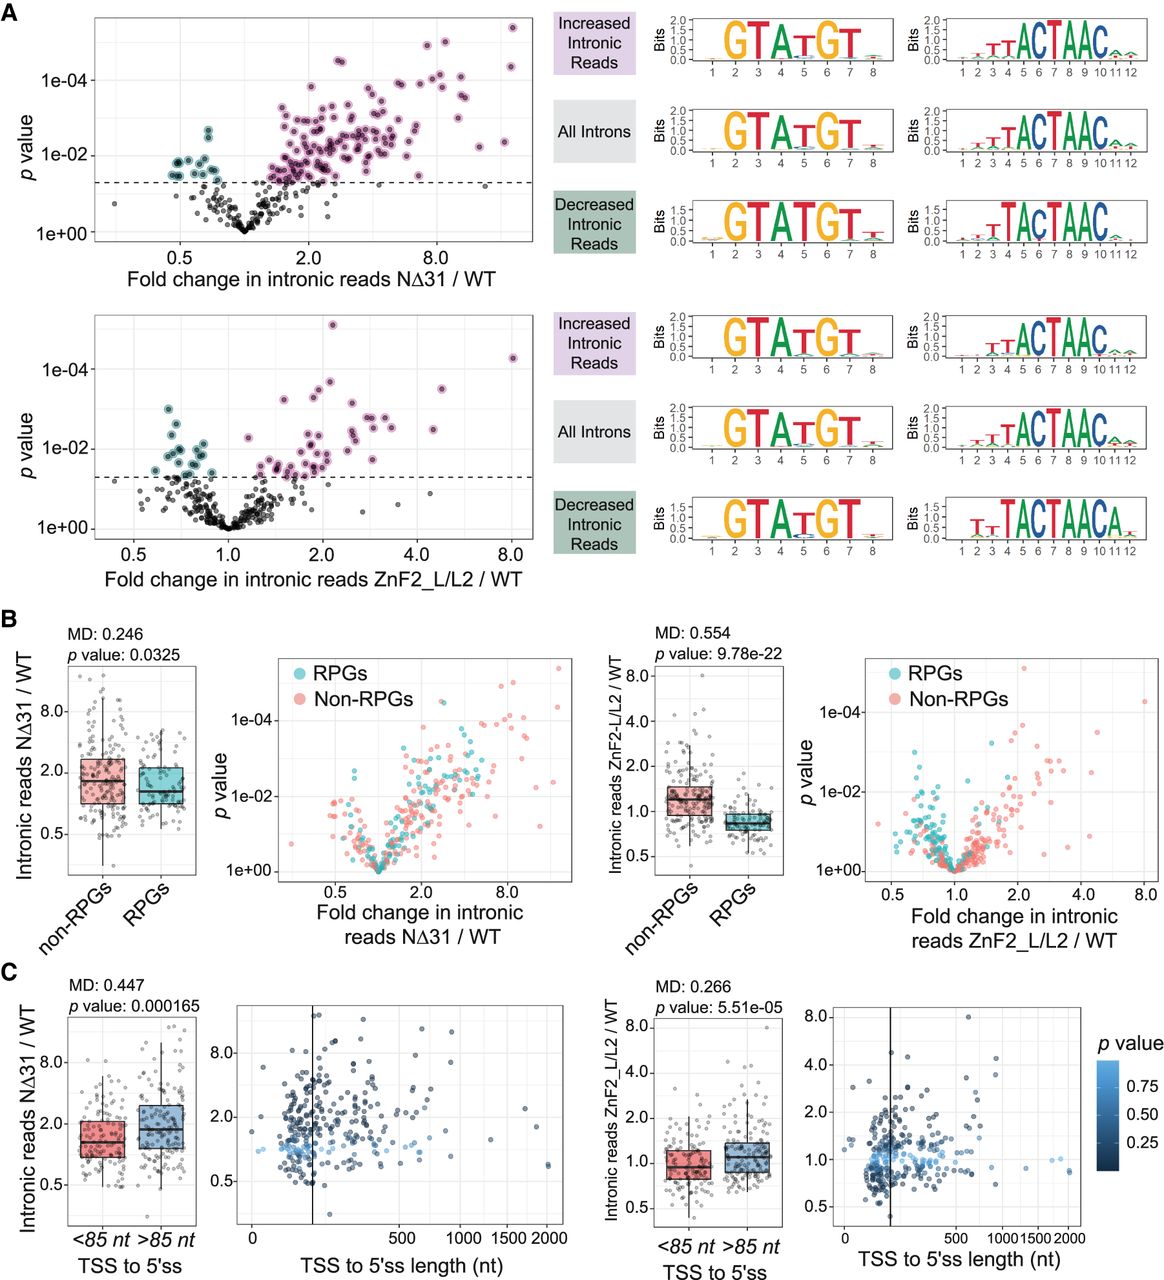
Analysis of RNA-seq data from cells expressing WT, NΔ31, or ZnF2_L/L2 Luc7 Proteins. (A) Plots showing changes in splicing efficiencies for each intron in Luc7 NΔ31 (top) and Luc7 ZnF2_L/L2 (bottom). p-values are the results of unequal variances t-tests using geometric means between three replicates. Introns with statistically significant changes in splicing efficiency were categorized into increased or decreased intronic reads in mutants over WT, p-value < 0.05 (dashed line). Sequence logos for 5′ss (middle) and BP (right) are shown for each category. (B) Changes in splicing efficiencies in Luc7 NΔ31 (left) and Luc7 ZnF2_L/L2 (right) versus WT for ribosomal protein genes (RPGs). Cyan points indicate RPGs. Histogram p-values are the results of unequal variances t-tests using geometric means. (C) Plots showing transcriptional start site to 5′ss distances versus changes in splicing efficiency for Luc7 NΔ31 (left) and Luc7 ZnF2_L/L2 (right) versus WT Luc7. Color indicates p-values. For plots in A–C, note that the x-axis in A and the y-axis in B and C represent fold changes. The black vertical line indicates 85 nt. (MD) Difference of geometric means.




