


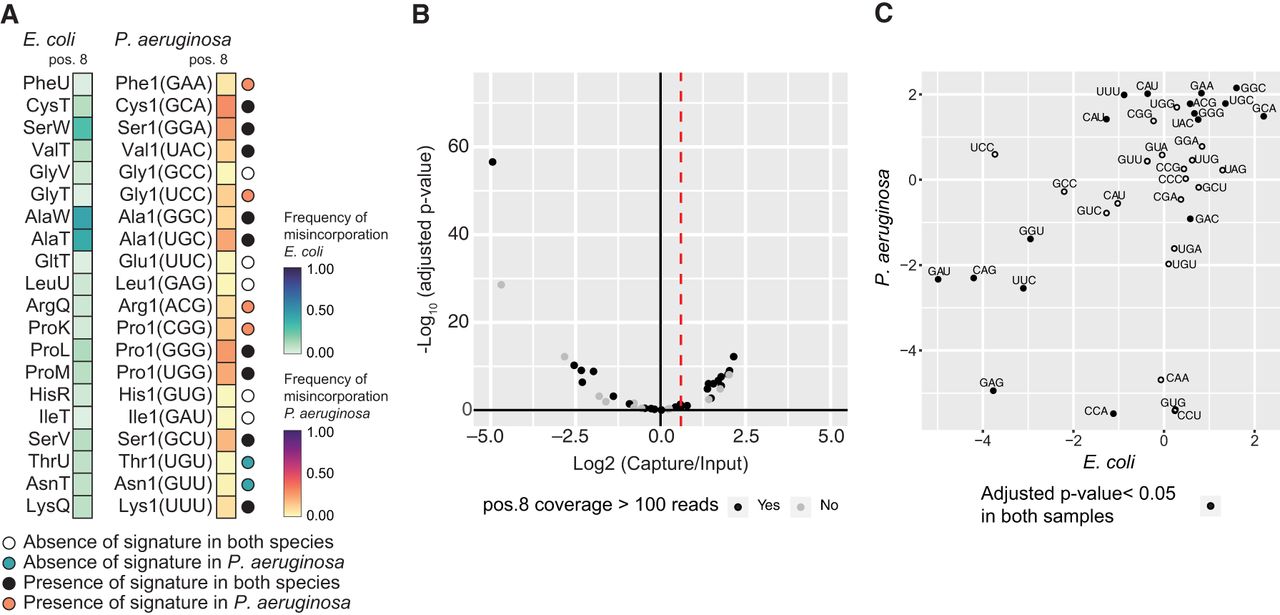
Conservation of s4U between Escherichia coli and Pseudomonas aeruginosa. (A) Heatmap of average (from three independent samples cultured in CDM) frequency of misincorporation at position 8 of isoacceptor homolog tRNAs in E. coli and P. aeruginosa. Only tRNAs with read coverage >100 at position 8 and with an identified isoacceptor homolog in both species are represented. The absence or presence of a signature based on a 5% cutoff of misincorporation is indicated on the right side of the heatmap with a circle mark. The key is listed below the heatmap. The criteria are based on the nature of the annotated modification. The GtRNAdb names are used for P. aeruginosa tRNAs. The anticodon is shown in parentheses. (B) Volcano plot representation of log2 fold change in abundance after MTSEA capture of tRNA from P. aeruginosa cells. Log2 fold change and adjusted P-value calculated with DESeq2. A dotted red line indicates the threshold used to define a tRNA as enriched (log2 fold change > 0.6). The color indicates if read coverage at position 8 is more than 100 in misincorporation frequency analysis. (C) Scatter plot representation of log2 fold change in abundance after MTSEA capture for isoacceptor homolog tRNAs from E. coli and P. aeruginosa. Log2 fold change and adjusted P-value calculated with DESeq2. Full circles indicate tRNAs that are significantly enriched in both samples.




