


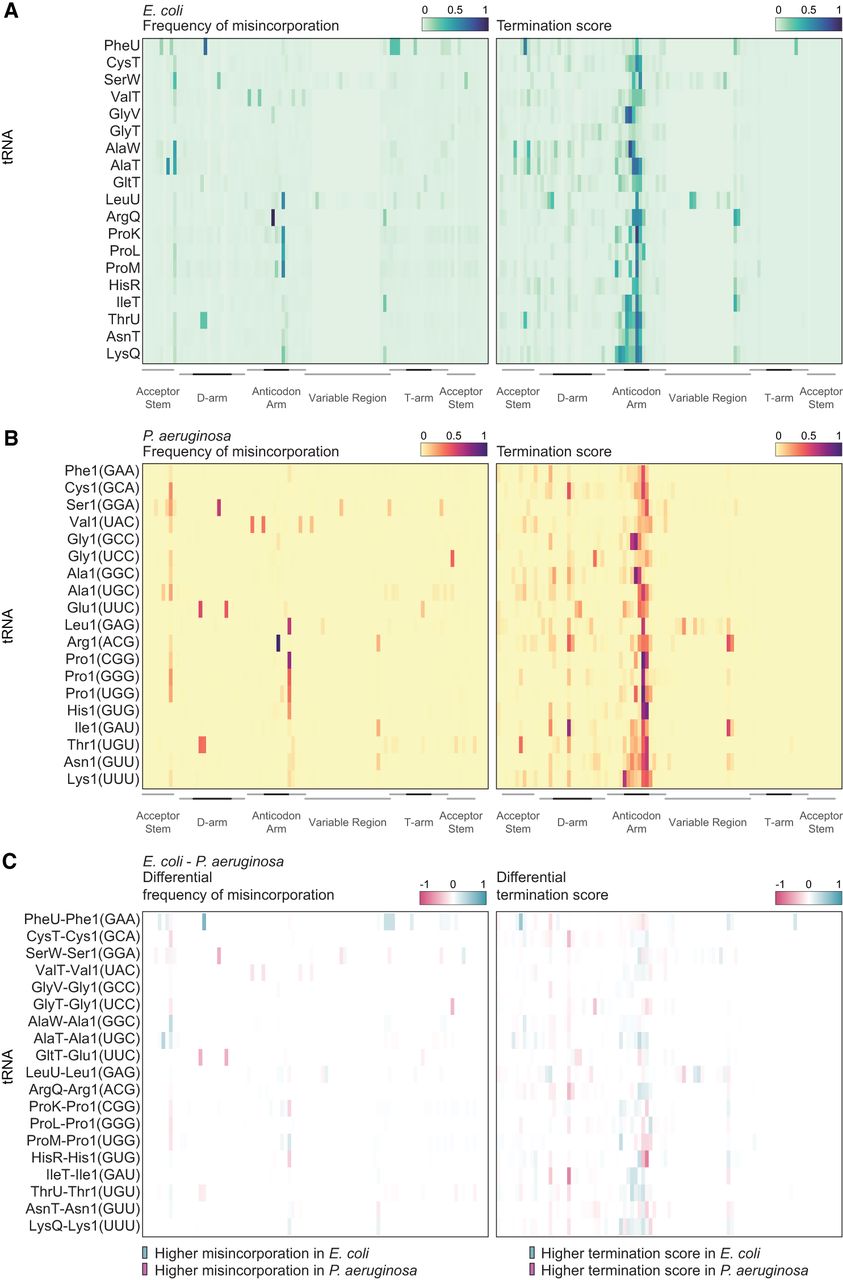
An Escherichia coli reference landscape for tRNA modifications. (A) Heatmap of average (from three independent samples) frequency of misincorporation (left) or termination score (right) at each position for E. coli tRNAs extracted from cells cultured in chemically modified media and collected at (OD)600 = 0.6. Only tRNAs with read coverage >100 at each position and with an identified isoacceptor homolog in Pseudomonas aeruginosa are represented. Different regions of the tRNA are represented at the bottom from the 5′ (left) to the 3′ end (right) of the tRNA. Darker lines indicate the loop in that region. (B) Heatmap of average (from three independent samples) frequency of misincorporation (left) or termination score (right) at each position for P. aeruginosa tRNAs extracted from cells cultured in chemically modified media and collected at (OD)600 = 0.6. Only tRNAs with read coverage >100 at each position and with an identified isoacceptor homolog in E. coli are represented. Different regions of the tRNA are represented at the bottom from the 5′ (left) to the 3′ end (right) of the tRNA. Darker lines indicate the loop in that region. The GtRNAdb names are used for P. aeruginosa tRNAs. The anticodon is shown in parentheses. (C) Heatmap of differential misincorporation frequency (left) or differential termination score (right) at each position for tRNAs with read coverage >100 at each position and with an identified isoacceptor homolog in E. coli and P. aeruginosa. Values are calculated as signal in E. coli subtracted of signal in P. aeruginosa. Sites with higher signal in E. coli are represented in blue gradient scale, whereas values with higher signal in P. aeruginosa are represented in a purple gradient scale.




