


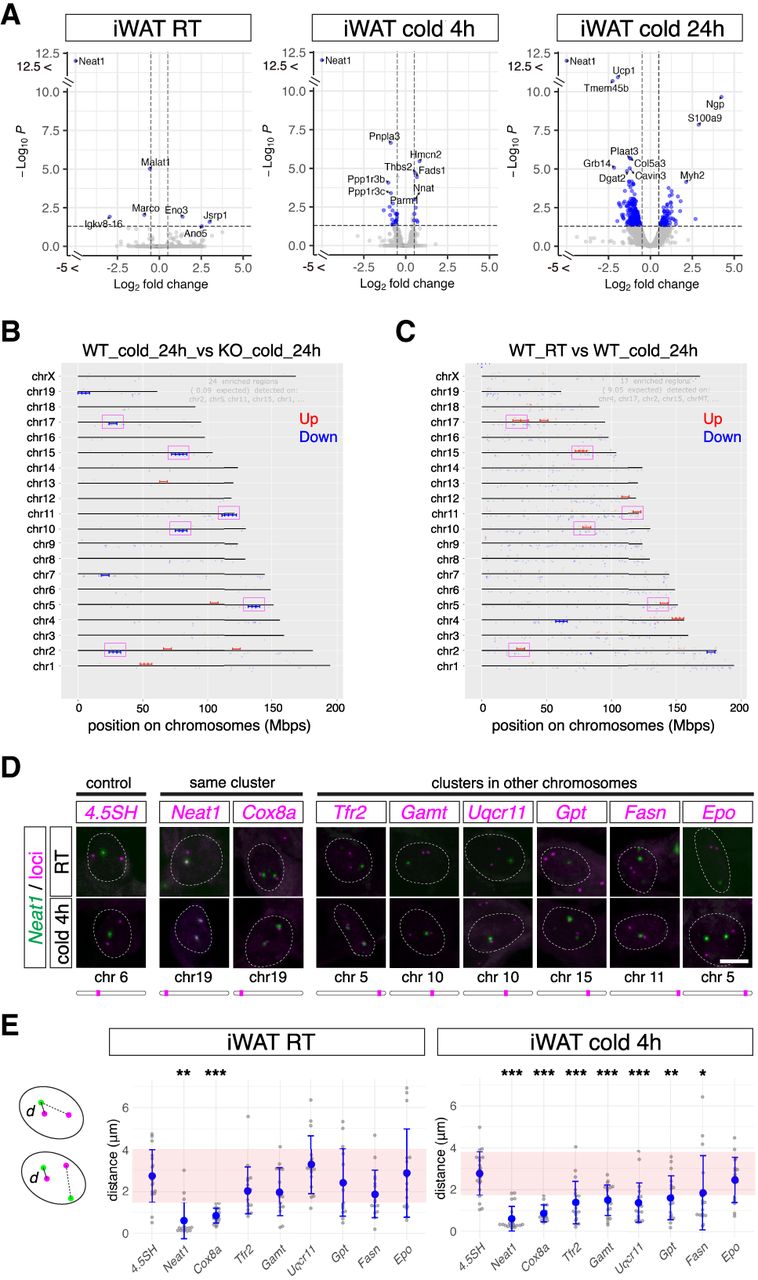
Clustering of differentially expressed genes in iWAT of Neat1 KO mice at specific genomic regions. (A) Volcano plot illustrating differentially expressed genes between WT and Neat1 KO mice at room temperature, and at 4 and 24 h after cold exposure. Blue dots represent genes with statistically significant changes (FDR < 0.05, log2 fold change >1) as calculated by DESeq2. Neat1 showed an exceptionally low log10 (FDR) and log2 fold change, which is force adjusted to 12.0 and 5.0, respectively, in the plots for visualization purposes. (B) Identification of genomic regions enriched in differentially expressed genes in Neat1 KO mice using the “Genome” function of iDEP. The genome was scanned with 6 Mbp windows and 2 Mbp overlap; blue and red bars with end caps indicate regions where average fold changes are statistically higher (red) or lower (blue) compared to other regions. Magenta rectangles highlight genomic regions enriched in genes downregulated in Neat1 KO mice but upregulated upon cold exposure in WT mice. (C) Genomic regions enriched in genes differentially expressed during beige adipocyte differentiation in iWAT. Magenta rectangles again highlight regions with genes downregulated in Neat1 KO mice but upregulated upon cold exposure in WT mice. (D) Simultaneous detection of paraspeckles and genomic loci of clustered genes downregulated in Neat1 KO mice. Paraspeckles were identified by Neat1 expression, and gene loci were detected by DNA FISH. The chromosomal positions of each gene are indicated below with magenta lines. (E) Statistical analysis of 3D distances between genomic loci shown in D and paraspeckles in iWAT at room temperature and 4 h after cold exposure. The shortest distance (d) between paraspeckles and each genomic locus was measured. The asterisks denote gene loci that are significantly closer to paraspeckles compared to the unrelated control gene locus 4.5SH: (***) P < 0.001, (**) P < 0.01, (*) P < 0.05, Dunnett's multiple comparisons test compared with 4.5SH. Pink rectangles indicate the range of distances between paraspeckles and unrelated gene loci (mean ± SD). Dotted lines represent the shape of each nucleus. Scale bar, 5 µm.




