


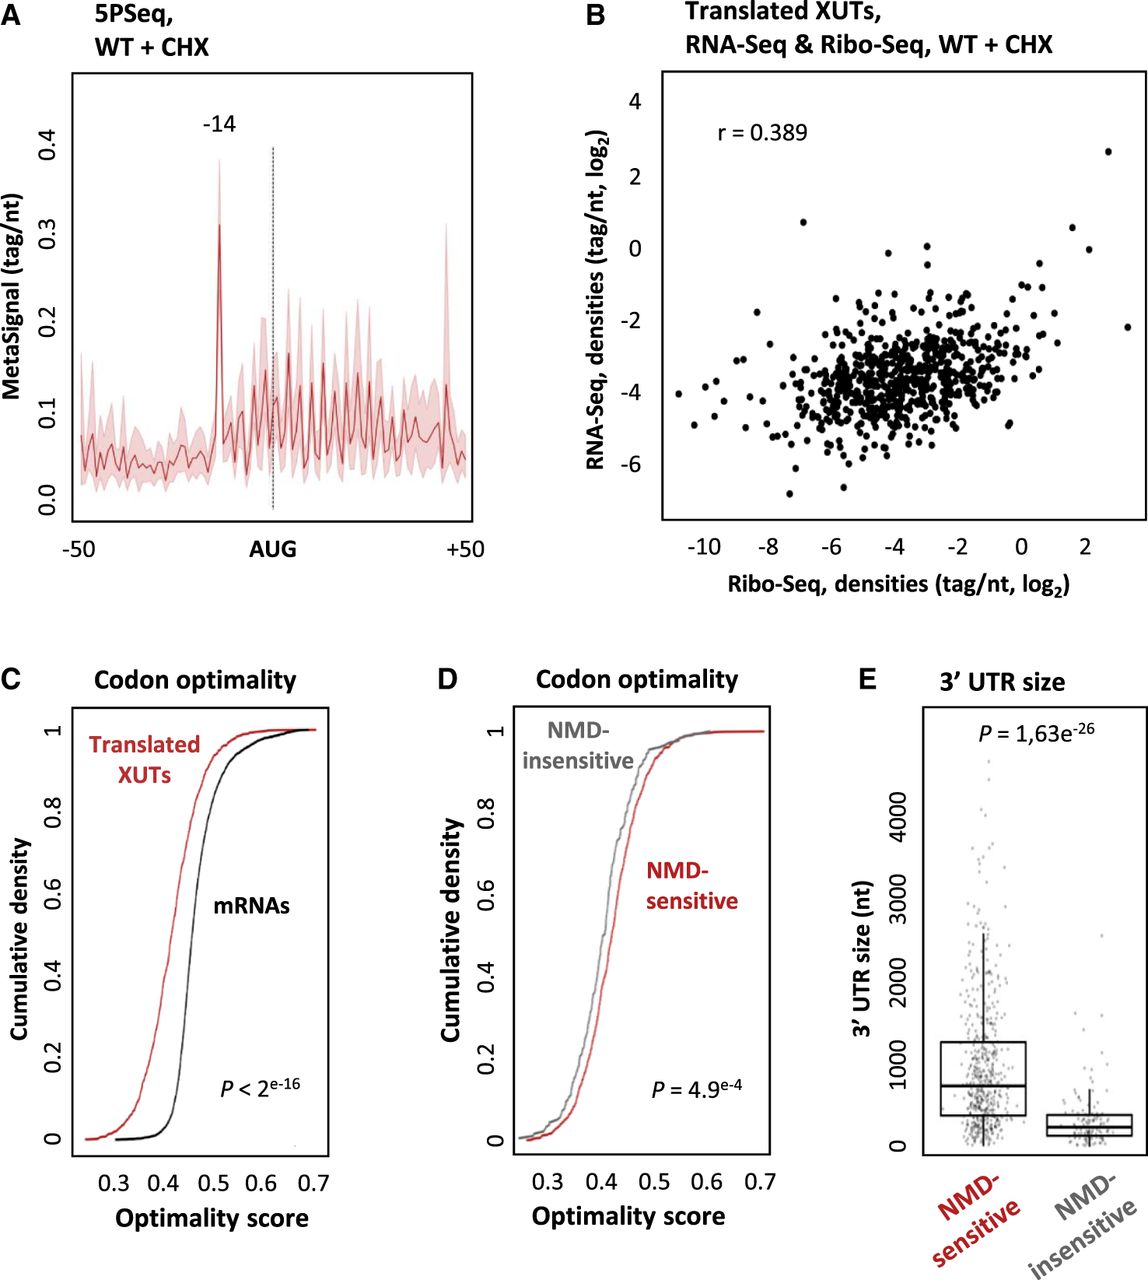
Features of translated XUTs. (A) Metagene of 5PSeq signals along positions −50 to +50 relative to the AUG codon of the smORF showing the highest signal for the translated XUTs. The peak at position −14 corresponds to the 5′ extremity of the footprint of the first ribosome, stalled at the level of the AUG codon. The shading surrounding the main line denotes the 95% confidence interval. Original data were obtained in CHX-treated WT cells by Pelechano's lab (Zhang and Pelechano 2021) and were retrieved from the NCBI Gene Expression Omnibus (accession number: GSE152375). (B) Scatter plot showing the Ribo-seq (TSS to TSS + 50) and RNA-seq signals (tag/nt, log2 scale) for the translated XUTs. The Pearson correlation coefficient (r) is indicated. (C) Average codon optimality score for the 633 translated XUTs (red) versus mRNAs (black), shown as a cumulative frequency plot. For XUTs with several annotated smORFs, we considered the smORF displaying the highest Ribo-seq signal. The indicated P-value was obtained upon the Kolmogorov–Smirnov test. (D) Same as above for the 510 NMD-sensitive (red) and 123 NMD-insensitive (gray) translated XUTs. (E) Box-plot showing the size of the 3′ UTR for the NMD-sensitive and NMD-insensitive translated XUTs. When several translated smORFs have been annotated for the same XUT, we considered the one with the highest Ribo-seq signal. The P-value was obtained upon a two-sided Wilcoxon rank-sum test.




