


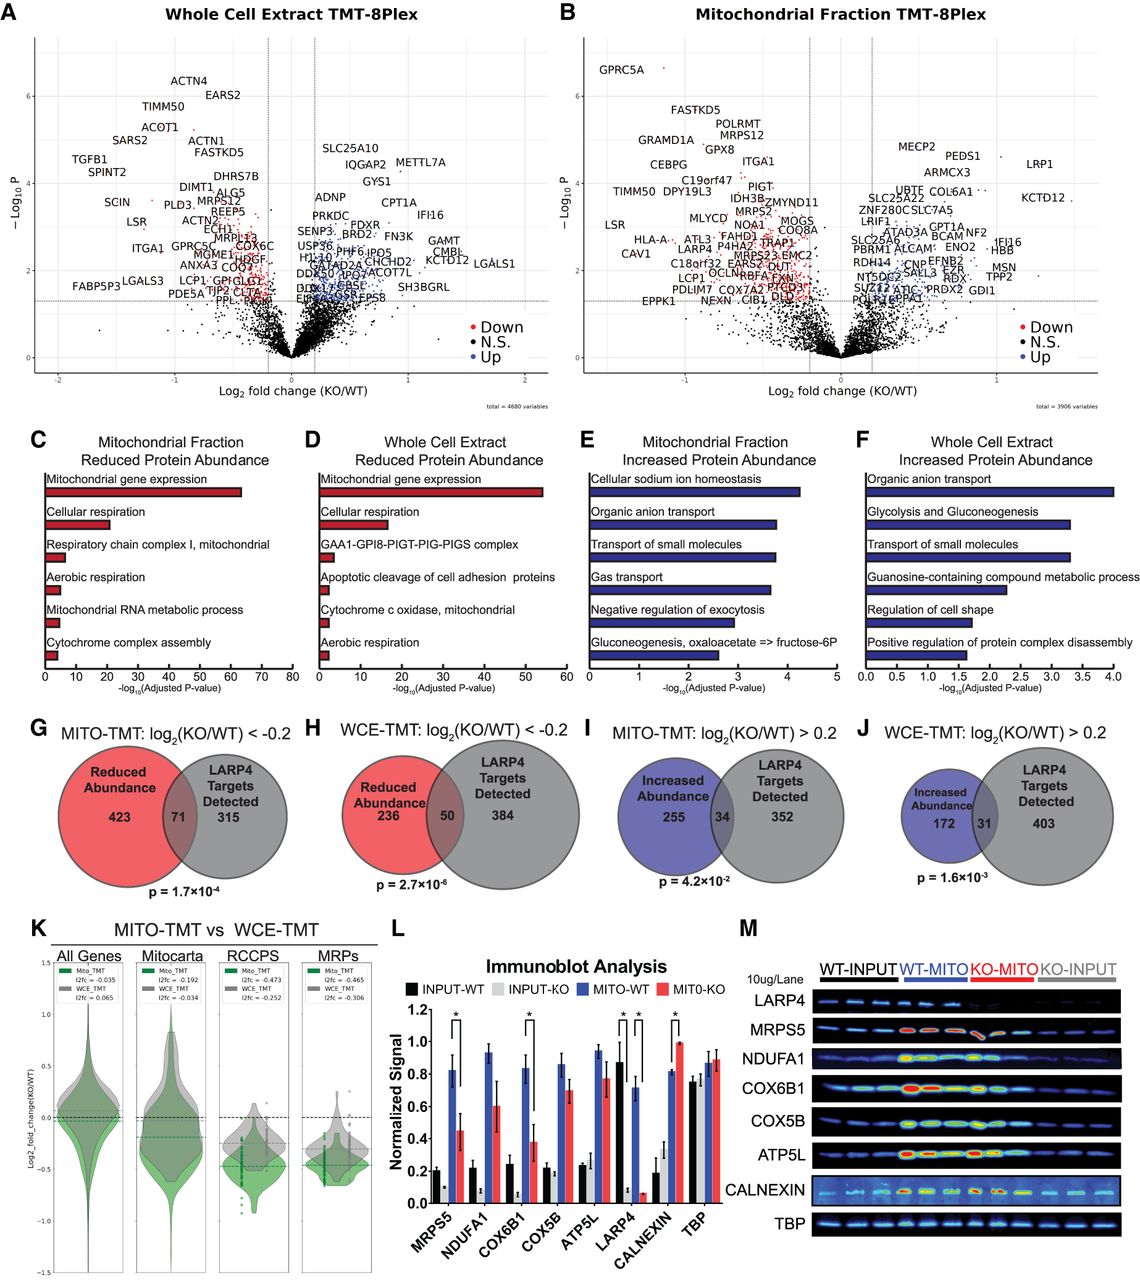
Quantitative proteomic analysis of the LARP4 KO cell line reveals reduced abundance of MRPs and OXPHOS proteins. (A) Volcano plot showing protein abundance (tag ratio of KO/WT) results from quantitative TMT analysis of WCEs (N = 4) prepared from HEK293LARP4−/− KO cells and WT cells. (B) Volcano plot showing protein abundance results from quantitative TMT analysis of mitochondrial enriched extracts (N = 4). (C,D) Metascape GO analysis of proteins with significant decreases in abundance identified by TMT analysis in mitochondrial enriched extracts (C) and WCEs (D). (E,F) Metascape GO analysis of proteins with significant increases in abundance identified by TMT analysis in mitochondrial enriched extracts (E) and WCEs (F). (G,H) Overlap of proteins with significant decreases in abundance identified by TMT analysis in mitochondrial enriched extracts (G) and WCEs (H). (I,J) Overlap of proteins with significant increases in abundance identified by TMT analysis in mitochondrial enriched extracts (I) and WCEs (J). (K) Violin plots comparing the changes in protein abundance of OXPHOS proteins and MRPs observed in the mitochondrial extract (green) and WCE (gray) proteomics experiments. Distributions shown are of average log2 (fold-change [KO/WT]) of proteins within each gene group. (L,M) Immunoblot analysis of WCEs (INPUT) and mitochondrial enriched extracts (MITO). Each lane was loaded with 10 μg of protein (M), and quantification of immunoblots from biological replicates (L). Significance thresholds for changes in protein abundance in TMT data are defined as P-value ≤ 0.05 and log2(fold-change [KO/WT]) ± 0.2. All averages shown are from independent biological replicates. Statistical significance of differences was assessed by two-tailed unpaired Student's t-tests (*) P ≤ 0.05. Statistical significance of enrichments was determined by the hypergeometric test.




