


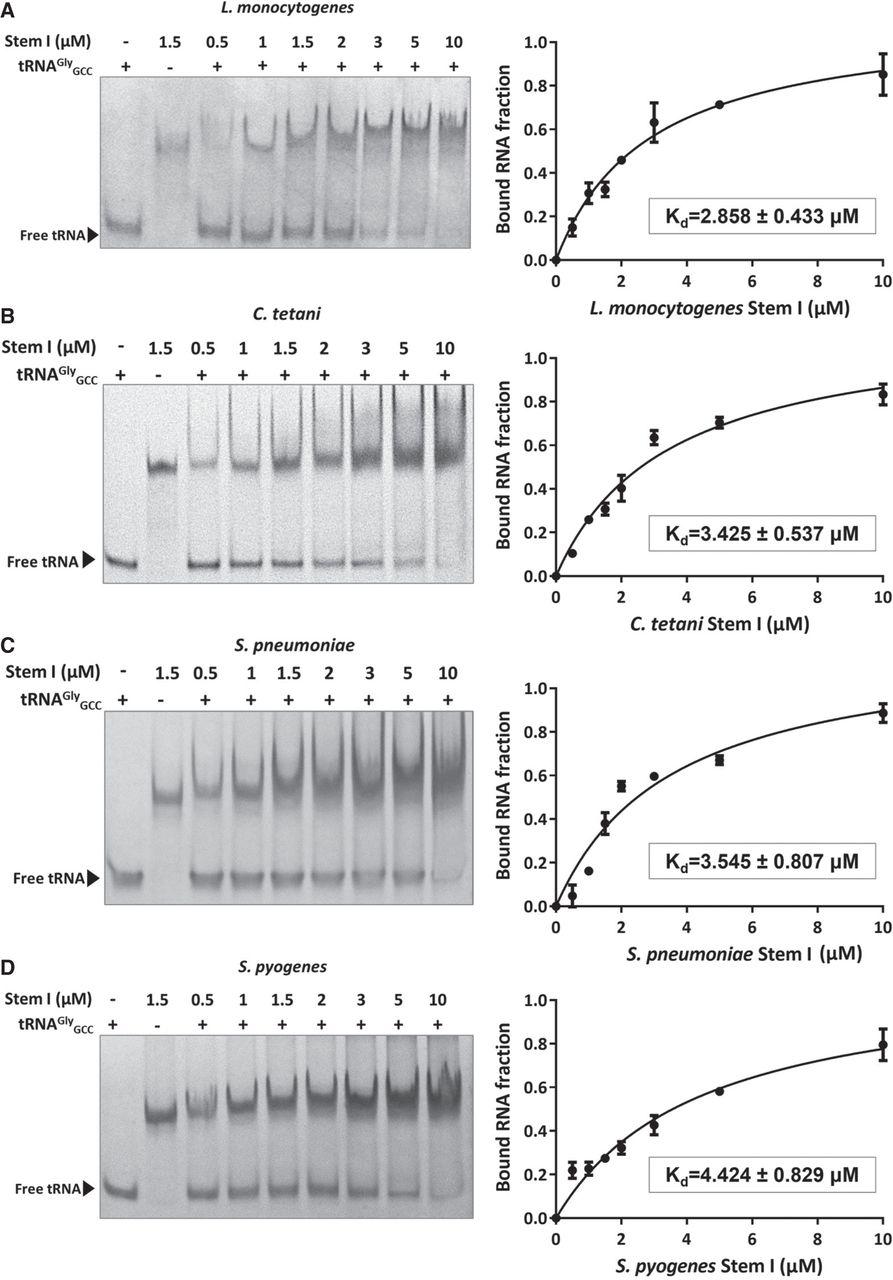
FIGURE 7.
EMSAs between increasing concentrations of (A) L. monocytogenes Stem I, (B) C. tetani Stem I, (C) S. pneumoniae Stem I, and (D) S. pyogenes Stem I domains from the respective glycyl T-boxes and 2 μM of tRNAGlyGCC. At the left, the Native PAGE images are shown, while at the right the binding curve of the bound tRNAGlyGCC against each Stem I is indicated. Also, the estimated Kd values for each complex are shown.




