


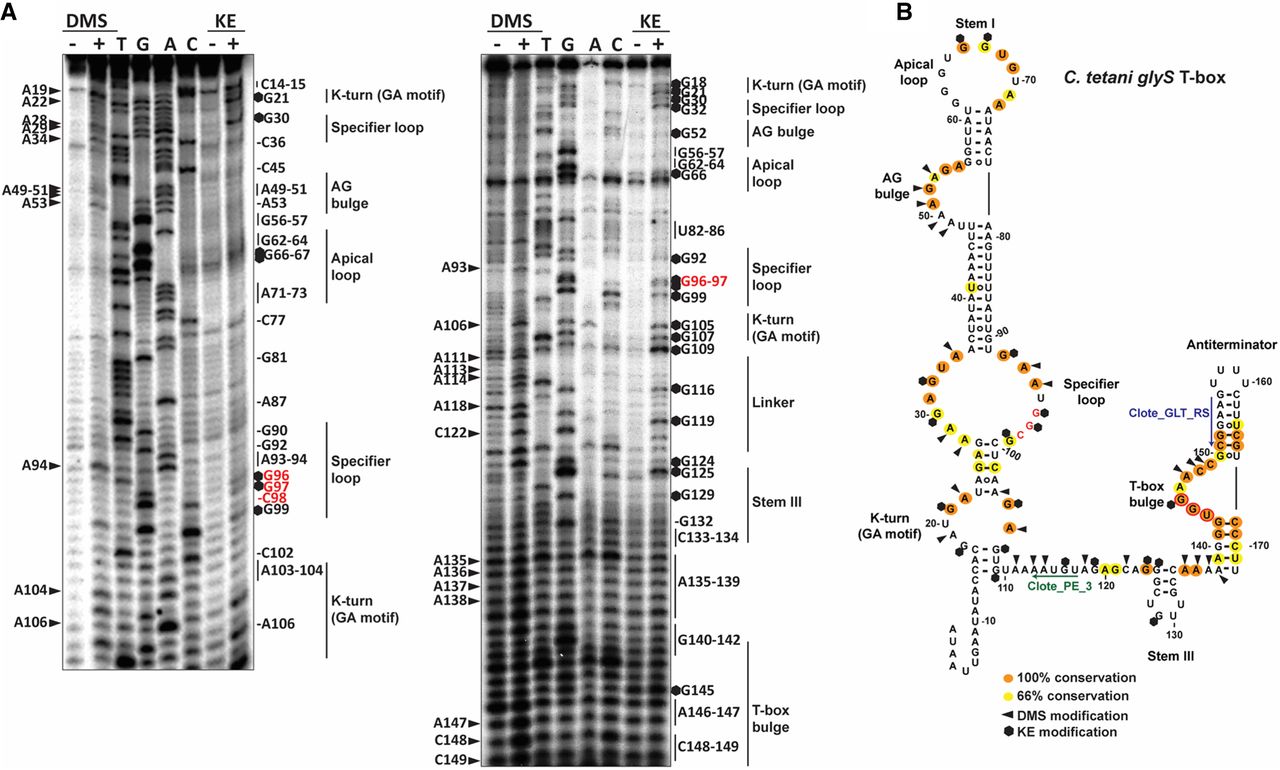
Chemical probing analysis of glyS T-box from C. tetani. (A) Α 6% PAGE/8 M urea denaturing gel showing primer extension analysis of modified with DMS or KE (+) and unmodified (−) C. tetani glyS T-box transcript (20 pmol). The triangles on the left correspond to DMS modifications, whereas the hexagons on the right identify KE modifications, according to the sequencing tracks (lanes T, G, A, and C). (B) The predicted secondary structure of C. tetani glyS T-box. Clote_PE_3 primer (in green) was used for Stem I primer extension analysis and Clote_GLT_RS (in blue) for the analysis of almost the whole T-box region. Highly conserved (100%) and moderately conserved (66%) nucleotides are indicated with orange and yellow circles, respectively. The specifier codon is indicated with red letters. The trinucleotide at the T-box bulge that interacts with the 3′ CCA of the tRNA is indicated with red circles.




