


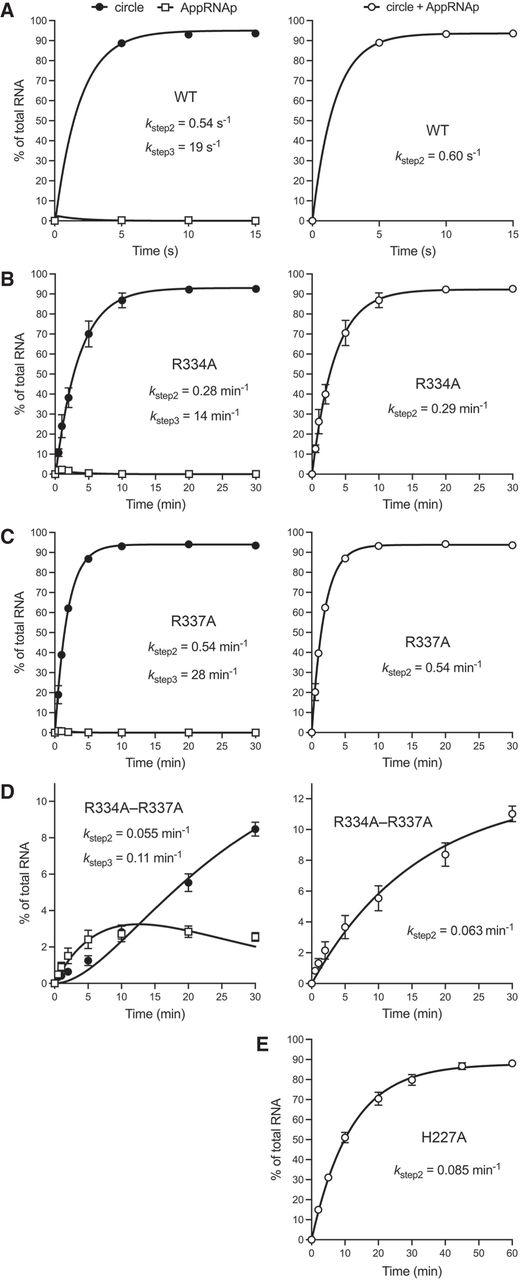
Kinetics of single-turnover ligation. (A) Individual replicate reaction mixtures (10 µL) containing 50 mM Tris-HCl, pH 8.0, 2 mM DTT, 5 mM MgCl2, 0.1 µM 5′ 32P-labeled 10-mer pRNAp substrate, and 2 µM wild-type CthLIG were incubated at 37˚C. The reactions were initiated by adding CthLIG to a prewarmed reaction mixture. The reactions were quenched after 5, 10, or 15 sec with an equal volume of 95% formamide/50 mM EDTA. The products were analyzed by urea-PAGE. The distribution of radiolabeled RNAs, either the individual AppRNAp and the ligated circle species (left panel) or the sum of AppRNAp and ligated circle (right panel) is plotted as a function of reaction time. Each datum in the graph is an average of five replicate reactions ± SEM. (B–E) Reaction mixtures (100 µL) containing 50 mM Tris-HCl, pH 7.5, 5 mM MgCl2, 0.1 µM 5′ 32P-labeled 10-mer pRNAp substrate, and 2 µM mutant CthLIG as specified were incubated at 37˚C. The reactions were initiated by adding mutant CthLIG to a prewarmed reaction mixture. Aliquots (10 µL) were withdrawn before adding enzyme (time 0) or at the times specified after enzyme addition and quenched immediately with an equal volume of formamide/EDTA. The products were analyzed by urea-PAGE. The distribution of radiolabeled RNAs is plotted as a function of reaction time. Each datum in the graphs is an average of three independent experiments ± SEM. The data in the graphs in the right column were fit by nonlinear regression to a one-phase association in Prism. The apparent step 2 (RNA adenylylation) rate constants are shown. The data in the graphs in the left column were fit by nonlinear regression to a unidirectional two-step kinetic mechanism. The Prism-calculated step 2 and step 3 (phosphodiester synthesis) rate constants are shown. Because there was no detectable AppRNAp formed during the H227A reaction, panel E includes only a one-phase association fit of the data in the graph in the right column.




