


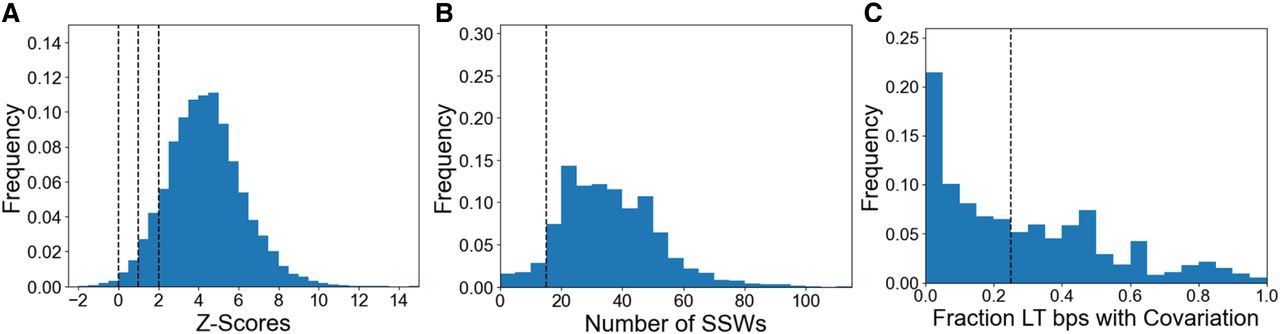
FIGURE 4.
Identification of LT helices of 23S rRNA by both methods. (A) The distribution of all shuffling method z-scores. Black dotted lines are drawn at z-scores of 0, 1, and 2 used to classify evidence for LT stems as absent, weak, intermediate, and strong. (B) The distribution of all covariation method SSW scores. The black dotted line corresponds to the threshold used to distinguish LT sequences with evidence for a stem from LT sequences without such evidence. (C) Histogram showing the degree of covariation across all structures, where the black dotted line corresponds to the threshold that distinguishes weak from strong covariation.




