


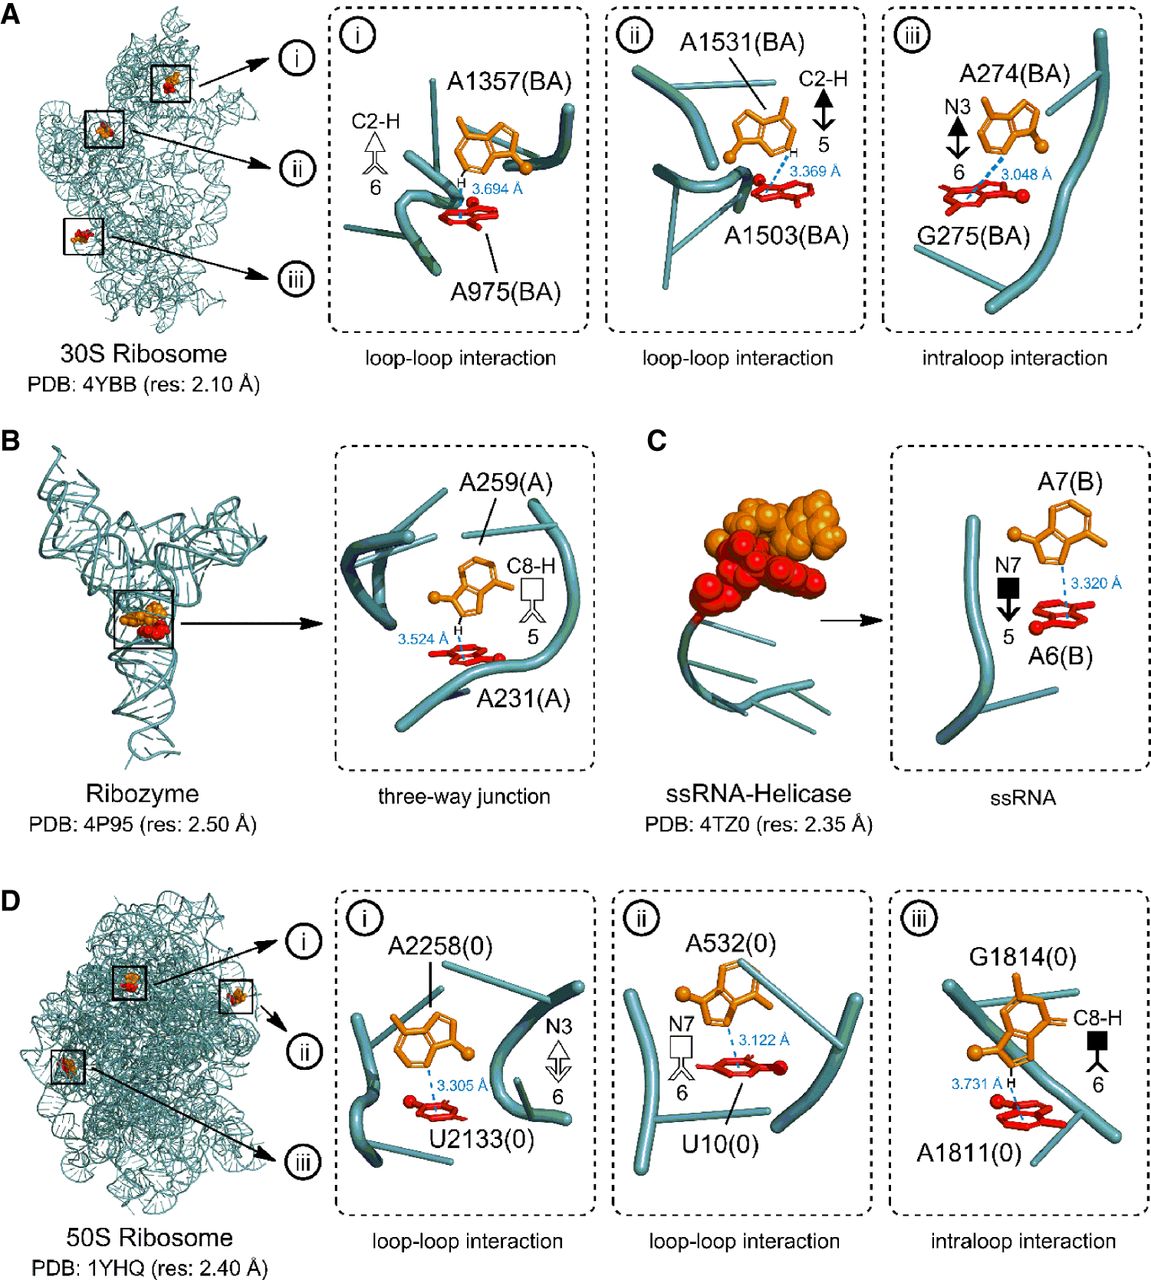
Sample T-shaped interactions from various high-resolution PDBs (PDB code and crystallographic resolution are provided for each source crystal structure), indicating the identity, residue number and chain (in parentheses) of each participating nucleotide. Each T-shaped interaction is indicated by a symbolic representation. The interacting atom of the horizontal base and the participating edge of the vertical base are indicated for each annotation. The distance between the interacting atom (heavy atom for the C-H group) of the vertical base and the center of the interacting ring of the horizontal base is provided. Although in some cases, one atom belonging to the interacting edge may visually appear closer than the other atom of the same edge, the interacting atom is identified using a quantitative method according to the algorithm described in the Materials and Methods section. Note that including the information on the ring identity of the horizontal base and the interacting atom/group of the vertical base is optional and can be removed in ambiguous cases.




