


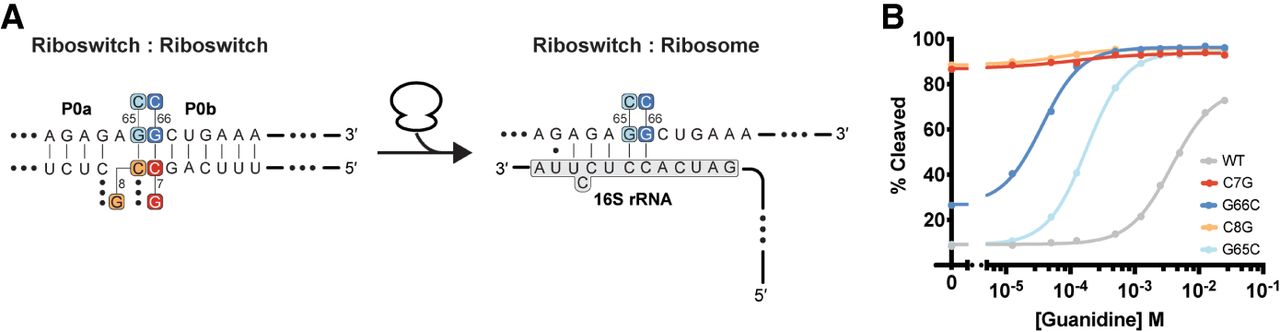
FIGURE 4.
P0b mutational asymmetry. (A) Secondary structure of the Pae gdm-II riboswitch pairing with its internal aSD compared with pairing with the Escherichia coli 16S rRNA aSD. (B) Representative response curves for transversions to C7, C8, G65, and G66




