


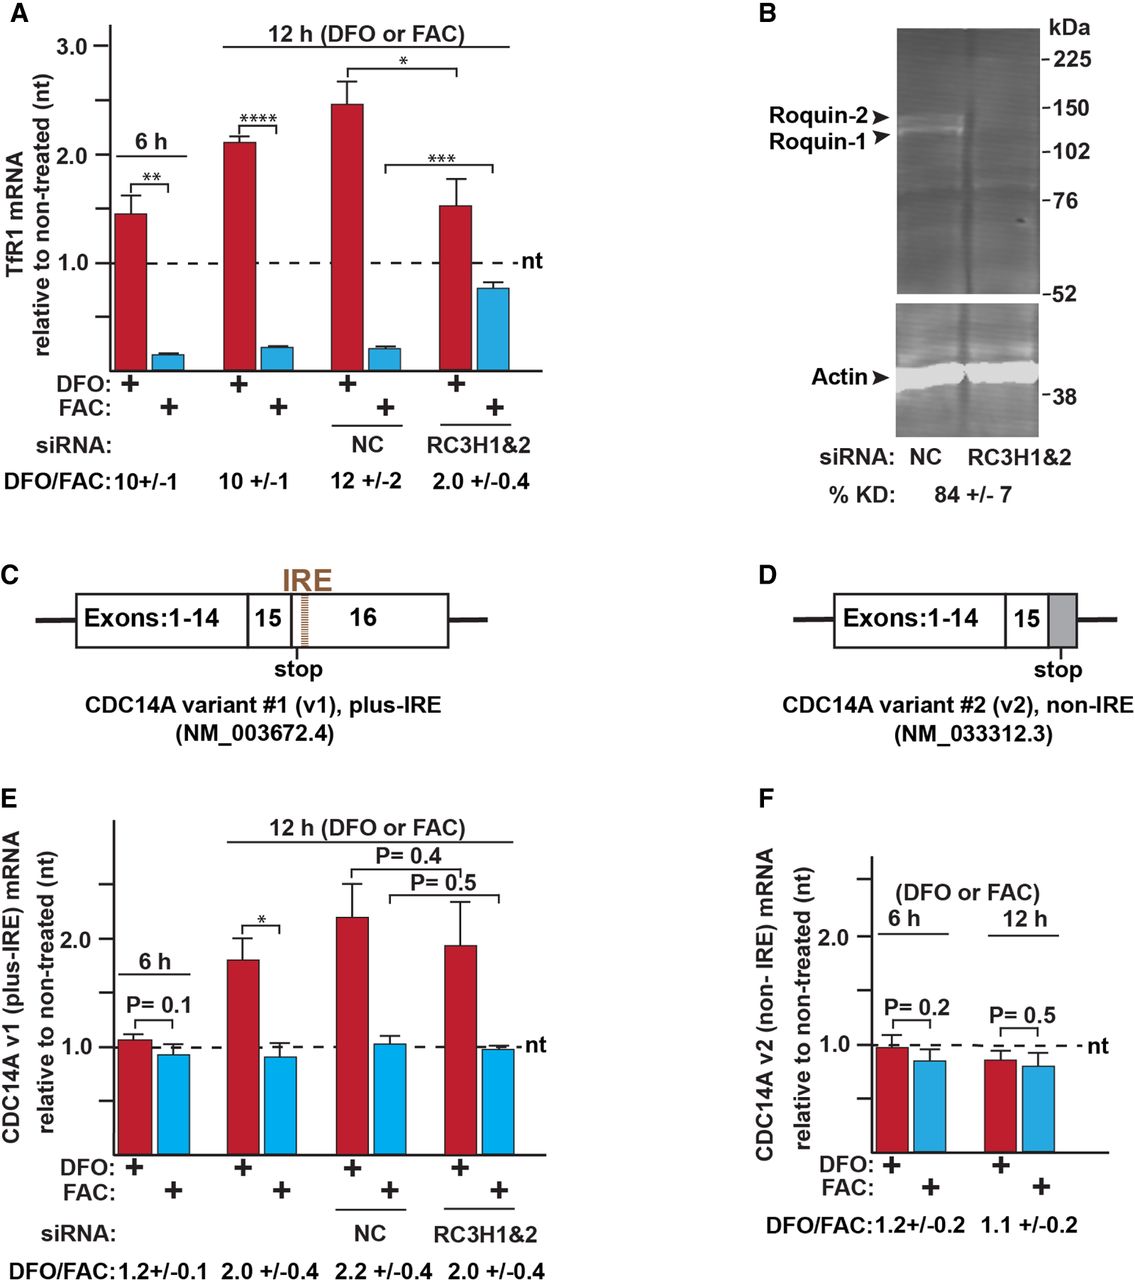
Steady-state changes to TfR1 and the CDC14A mRNAs in response to the iron status of the growth media and a Roquin KD. (A) Changes to the TfR1 mRNA abundance in response to iron-poor (red) or iron-rich (blue) treatments for 6 and 12 h relative to normal growth media (nt). The iron regulation of TfR1 mRNA abundance is attenuated by the Roquin KD in the cells compared to the negative control (NC) siRNA treatment. This is indicated by the ratio of the TfR1 mRNA abundance under DFO and FAC conditions being reduced to two. (B) Western analysis of the Roquin KD efficiency in the HEK293 cells. (C) Schematic of the CDC14A variant #1 exons indicating the location of the IRE within its 3′ UTR. (D) Schematic of the exons of CDC14A variant #2, which does not contain an IRE. (E) Changes to the CDC14A plus-IRE variant in response to the iron status of the growth media and the Roquin KD. (F) Changes to the CDC14A non-IRE variant in response to the iron status of the growth media. The ΔΔCq method was used to quantify changes in the mRNA amplicons relative to an RPL4 reference. Statistical significance was analyzed by two-tailed Student's t-test. (*) P < 0.01; (**) P < 0.001; (***) P < 0.0001; (****) P < 0.00001. All error bars represent ±SEM of three biological replicates.




