


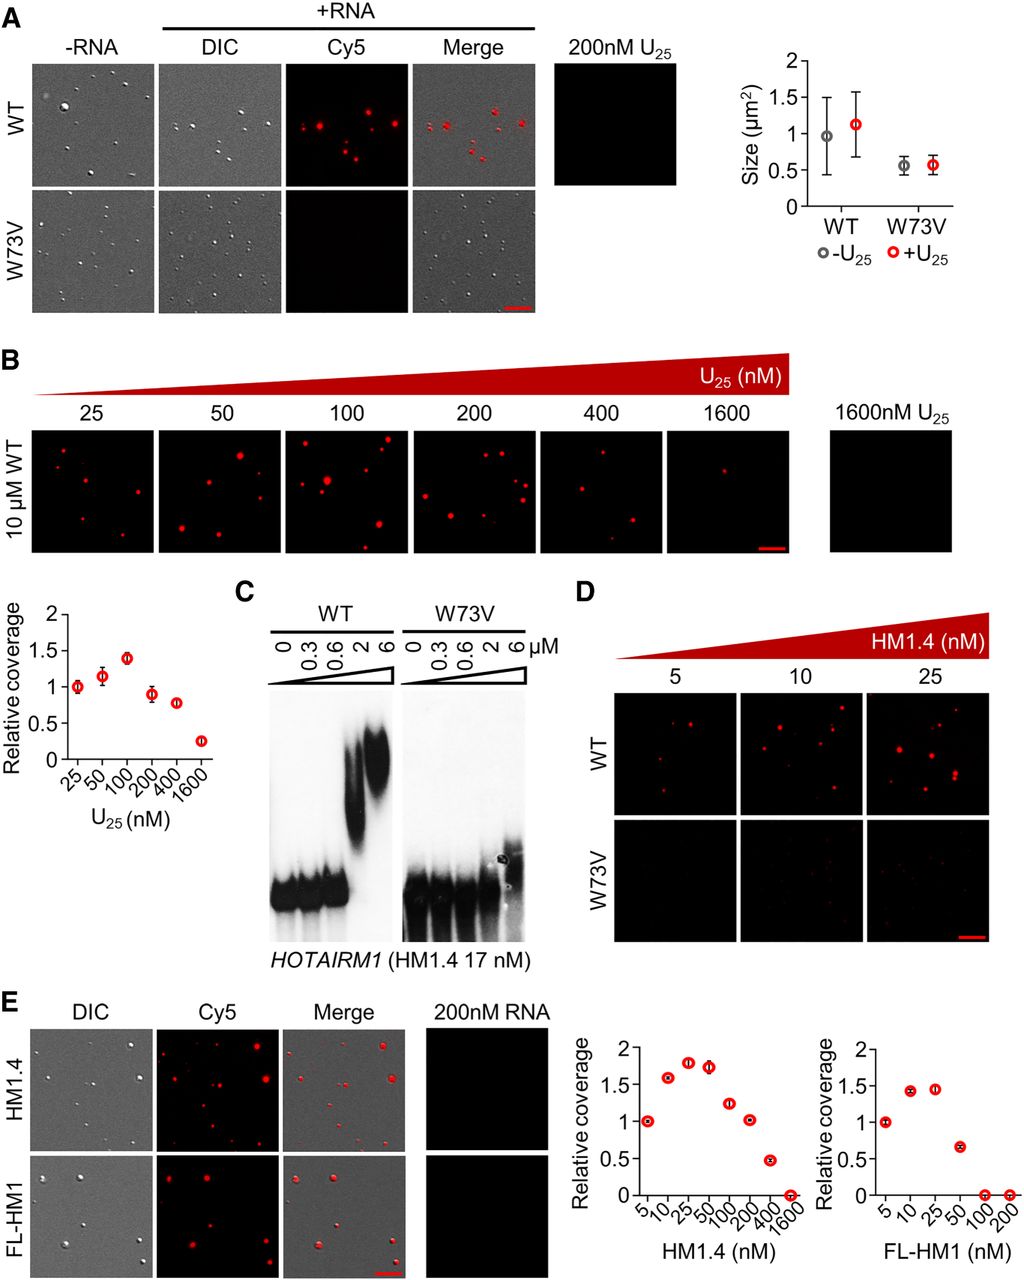
RNA modulates LLPS of Y14. (A) Wild-type or W73V Y14 (20 µM) was mock-incubated (no RNA, DIC) or incubated with 200 nM Cy5-labeled U25 (DIC, Cy5, and merge) in a pH 6.5 buffer containing 50 mM KCl for 2 h. Cy5-labeled U25 (200 nM) alone is shown at right. Bar, 5 µm. Dot graph shows the size of droplets in the absence or presence of RNA (50 droplets were used for measurement). (B) Y14 (10 µM) was incubated with increasing concentrations of U25 RNA (a mixture of Cy5-labeled and unlabeled U25 RNA). Bar, 5 µm. Cy5-labeled U25 (1600 nM) alone is shown at right. Dot graph shows the relative coverage rate of Y14 in the presence of different concentrations of U25. Coverage rate at 25 nM U25 was set to 1. N = 3. (C) EMSA showing Y14 (wild-type or W73V, concentration as indicated) binding to 32P-labeled HM1.4 (HOTAIRM1 632-882, 17 nM). (D) Wild-type or W73V Y14 (10 µM) was mixed with Cy5-labeled HM1.4 (concentration as indicated) for the LLPS assay. Bar, 5 µm. (E) Wild-type Y14 (10 µM) was mixed with Cy5-labeled HM1.4 (5 to 1600 nM) or full-length HOTAIRM1 (FL-HM1, 5 to 200 nM) for the LLPS assay. Representative images (DIC, fluorescence, merged) show Y14 LLPS in the presence of 25 nM RNA. Cy5-labeled RNAs (200 nM) alone are shown at right. Bar, 5 µm. Dot graphs show the relative coverage rate that was measured over the entire range of concentrations of HM1.4 and full-length HOTAIRM1 (FL-HM1). N = 3.




