


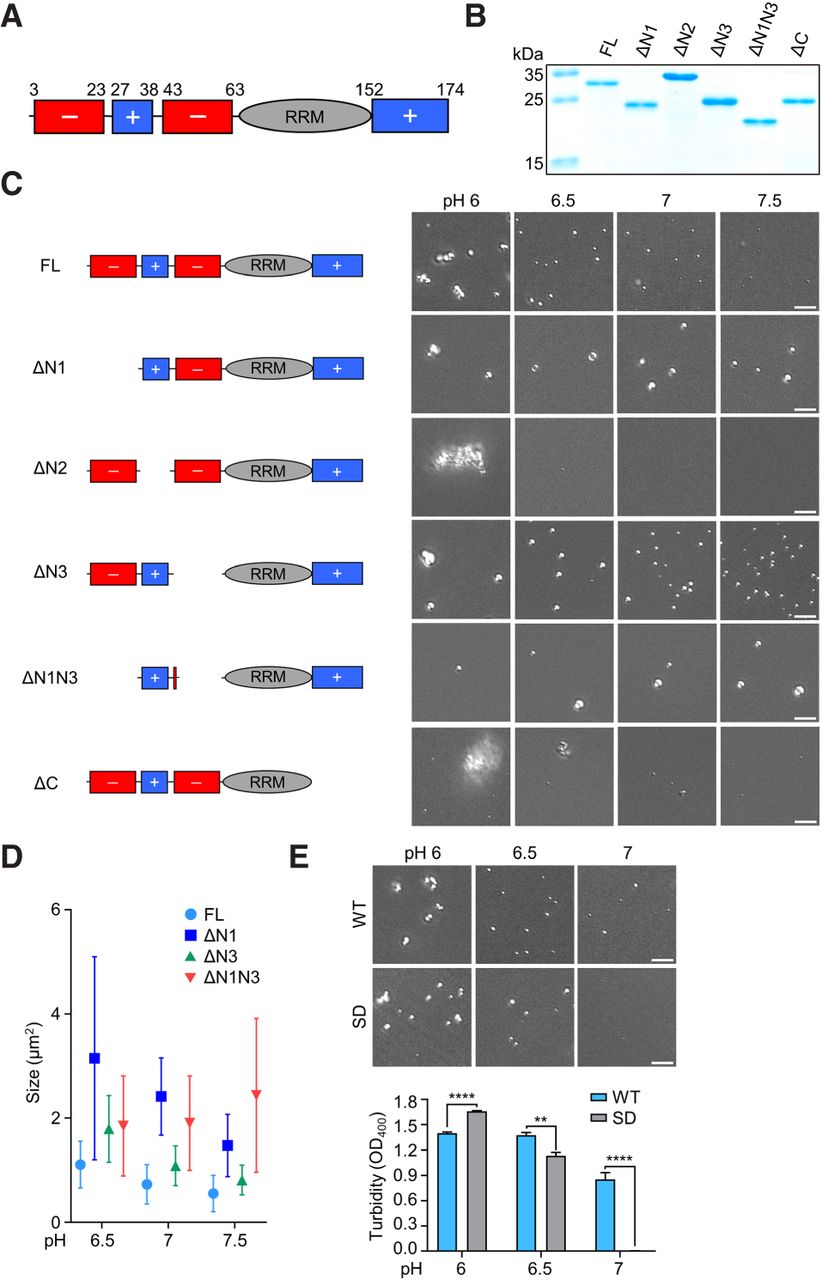
Charged regions of Y14 differentially influence LLPS. (A) The domain and subdomain organization of human Y14. Negatively and positively charged regions are indicated in red and blue, respectively. (B) SDS-PAGE gel showing purified recombinant full-length and truncated Y14 proteins. Protein bands were stained with ToolStart Blue Staining Reagent. ΔN2 showed a molecular weight larger than expected perhaps due to its high negative charge density in the amino terminus. (C) Diagrams showing domains of full-length and truncated Y14 proteins. Droplet formation for all Y14 versions (20 µM each) was performed at different pH values. Representative DIC images are shown. Bar, 5 µm. N > 3. (D) The droplet size of Y14 proteins as indicated was measured from the images of C. Mean and standard deviation were calculated for 50 droplets each. (E) DIC images showing droplet formation of wild-type Y14 or Y14-SD in buffer containing 50 mM KCl at the pH values indicated. Representative images (200 × 200 pixels) are shown. Bar, 5 µm. N = 3. Bar graph: the turbidity was measured as in E (mean ± SD; N = 2–4; [**] P < 0.01, [****] P < 0.0001).




