


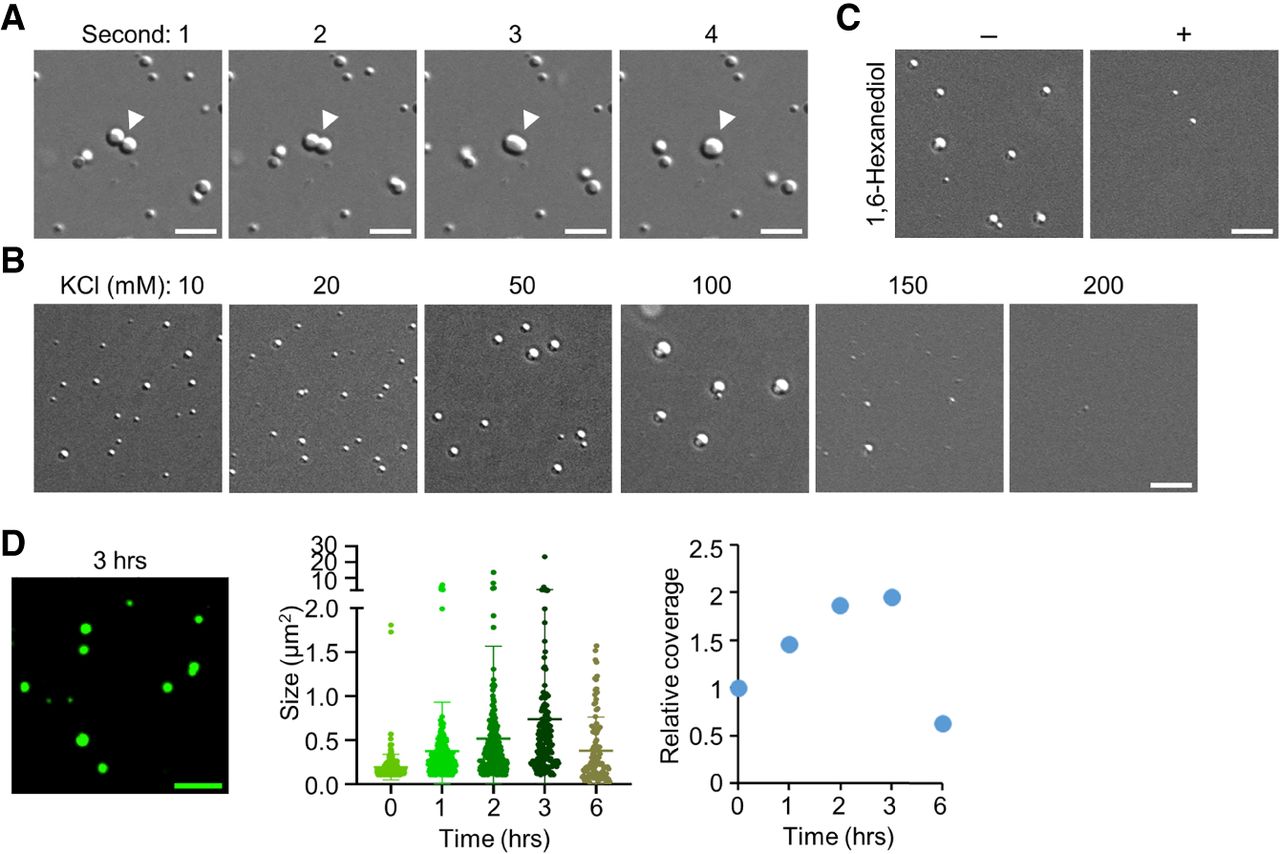
Characterization of phase-separated droplets of Y14. (A) The LLPS assay was performed using 50 µM Y14 in a pH 6.5 buffer containing 50 mM KCl. DIC images show the time course of a fusion event of Y14 droplets (arrowhead). Bars, 5 µm. (B) Y14 (20 µM) was incubated in a pH 6.5 buffer containing different concentrations of KCl as indicated. Bar, 5 µm. N = 3. (C) Y14 (20 µM) was incubated in a pH 6.5 buffer containing 50 mM KCl in the absence or presence of 1,6-hexanediol. Bar, 5 µm. (D) A mixture of Alexa Fluor 488-conjugated Y14 and unlabeled Y14 at the molar ratio of 1:50 was incubated in a pH 6.5 buffer containing 50 mM KCl for different times. A representative fluorescent image (200 × 200 pixels) shows the droplets after 3-h of incubation. Bar, 5 µm. The coverage rate (the coverage area of fluorescent signals divided by the total area) was measured by the software MetaMorph. Mean size and relative coverage rate (time 0 was set to 1) of the droplets are shown in the dot graphs.




