


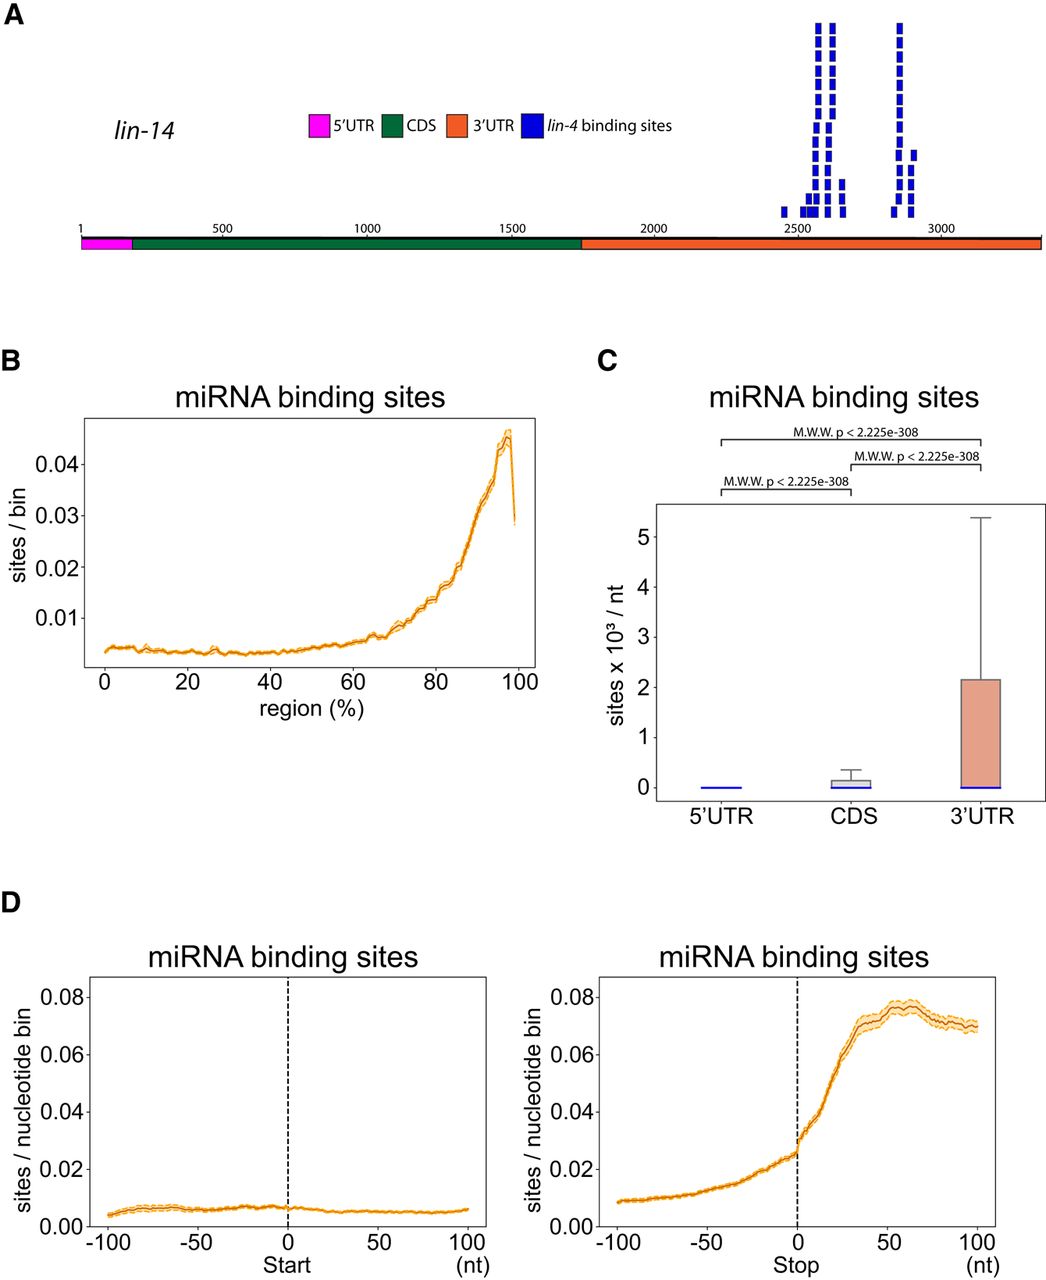
In vivo miRNA binding sites are enriched at the 3′ UTR of mRNAs in C. elegans. (A) lin-4 miRNA in vivo binding sites found in lin-14 mRNA. (B) Metagene trace shows the distribution of miRNA binding sites along an mRNA. The solid line indicates the average number of miRNA binding sites in all mRNAs. The dotted lines indicate the average number plus/minus one standard error. (C) The density of miRNA binding sites in the indicated regions. Blue lines represent median values. The statistical significance (P-value) of the difference in density between two regions was calculated by the Mann–Whitney U-test. (D) The distribution of miRNA binding sites around the start codon (left) or stop codon (right). A 200 nt window centered at start or stop codon is shown. The solid line indicates the average number of miRNA binding sites in all mRNAs. For each position, the average is calculated from all mRNAs that possess that position. For example, not all mRNAs have 5′UTRs, but they all have CDSs. The dotted lines indicate the average number plus/minus one standard error.




