


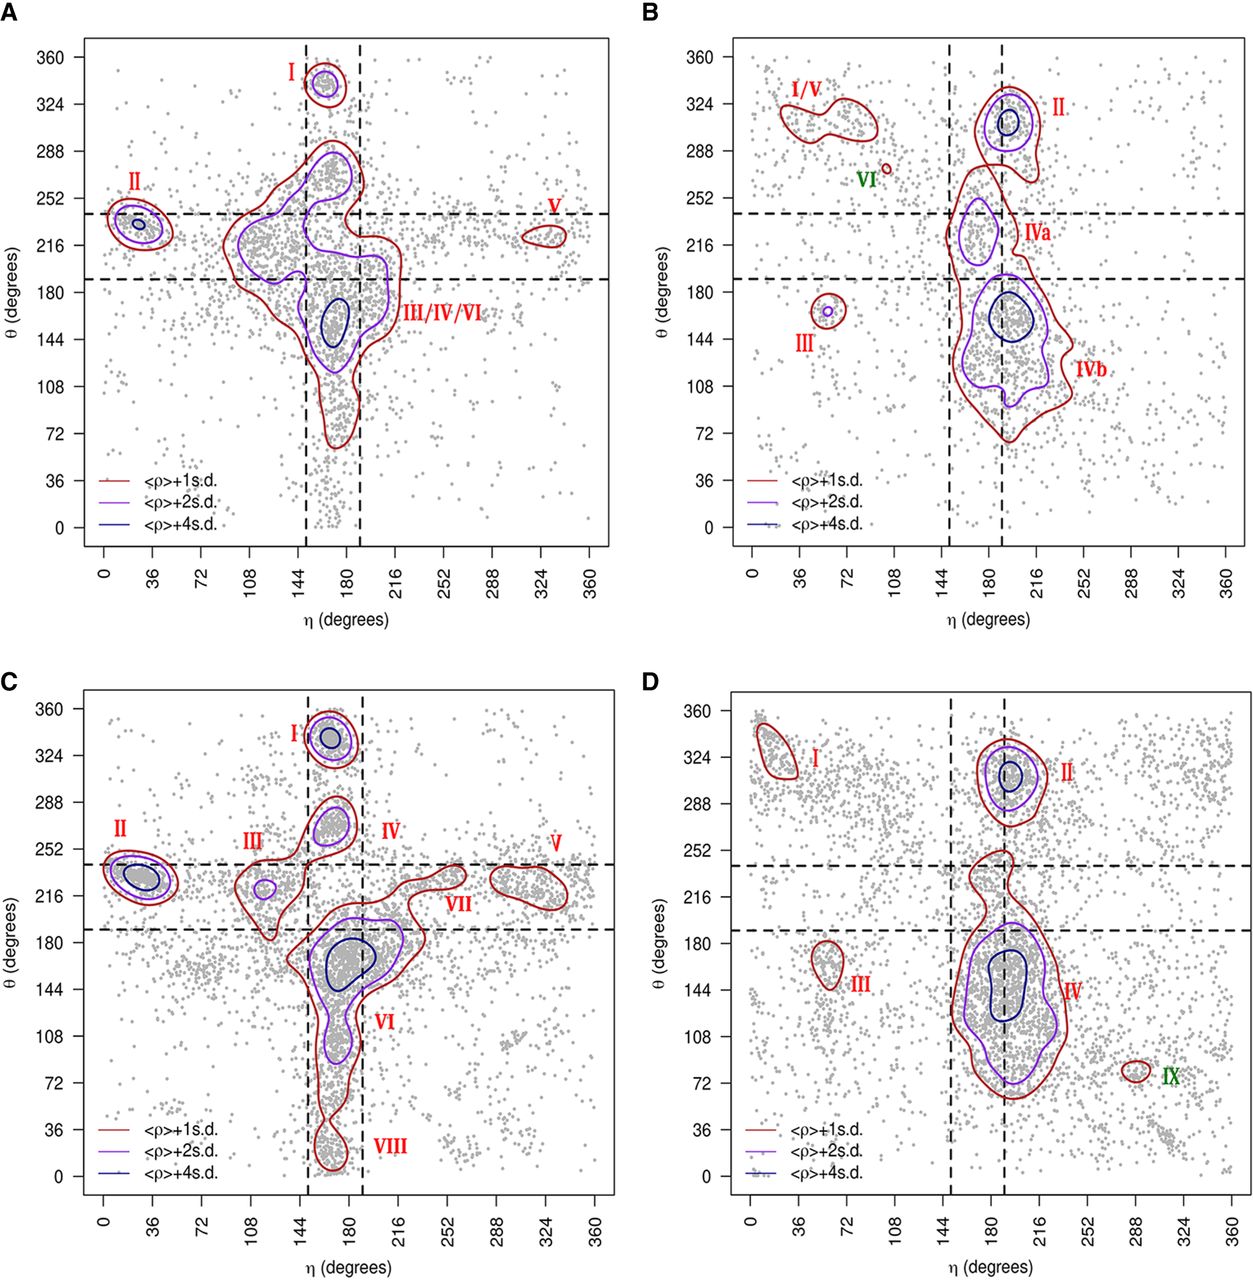
η − θ conformational space described by the naked-subset and protein-subset. Results are divided into nonhelical North (panels
on the left) or South (panels on the right) sugar conformations. Density contours of  (X = 1, 2, or 4; dark red, violet, and dark blue, respectively) highlight regions of the plots with a significant population
of nucleotides. Black dashed lines delimit the region occupied by canonical helical A-form (those structures are removed from
the analyses as described in the Materials and Methods section). Cluster numbers are identified in red or dark green when
they were not seen in the complete-data set depicted in Figure 2. (A) Densities and cluster analysis of the naked-subset for central nucleotides with sugars in North. (B) Same as (A) for South conformations. (C,D) are the same as (A) and (B) for the protein-subset.
(X = 1, 2, or 4; dark red, violet, and dark blue, respectively) highlight regions of the plots with a significant population
of nucleotides. Black dashed lines delimit the region occupied by canonical helical A-form (those structures are removed from
the analyses as described in the Materials and Methods section). Cluster numbers are identified in red or dark green when
they were not seen in the complete-data set depicted in Figure 2. (A) Densities and cluster analysis of the naked-subset for central nucleotides with sugars in North. (B) Same as (A) for South conformations. (C,D) are the same as (A) and (B) for the protein-subset.




