


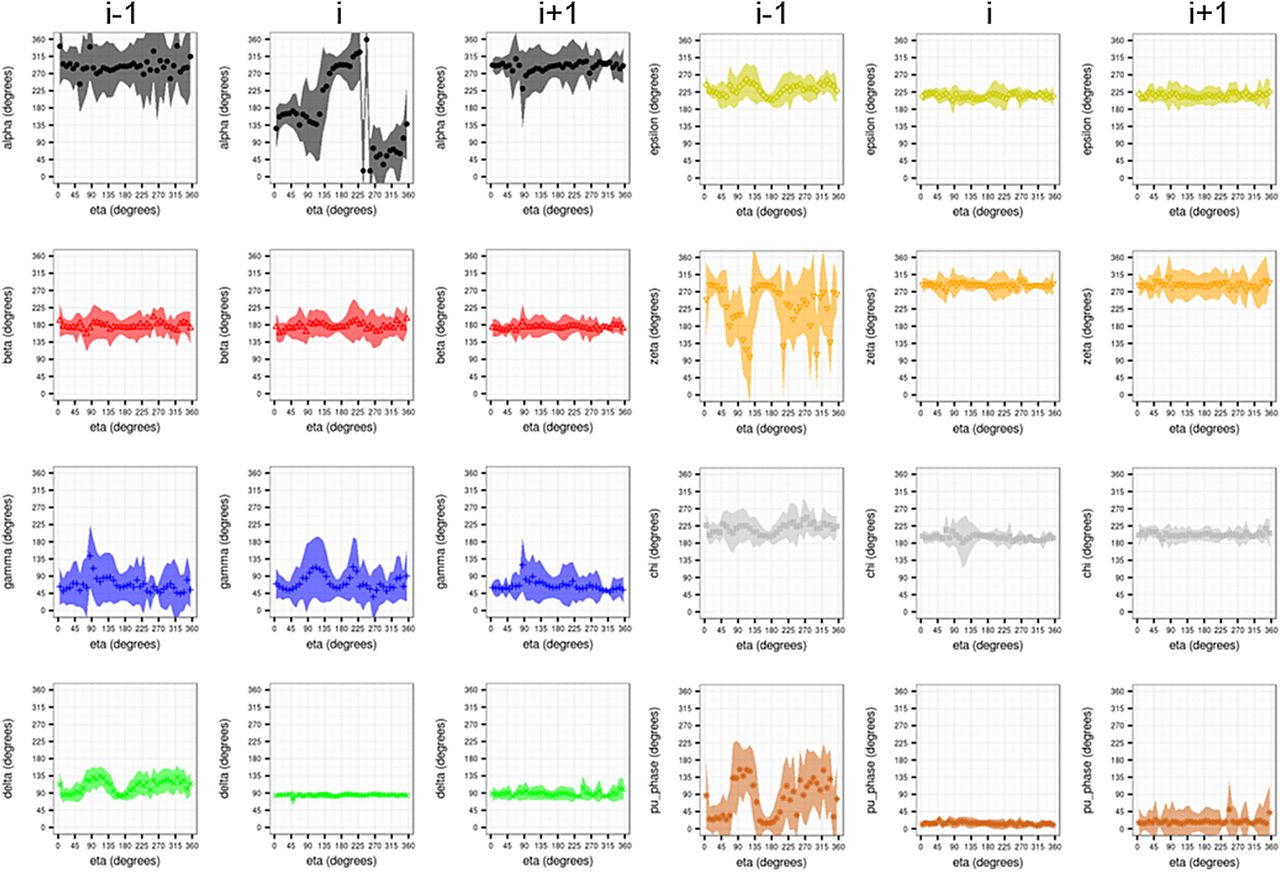
FIGURE 3.
Distributions of real dihedral angles in the nucleotides i − 1 (panels on the left), i (mid-panels), and i + 1 (panels on the right), as a function of the pseudodihedral angle eta (η) in the central nucleotide i. Panels show: α (black), β (red), γ (blue), δ (green), ε (yellow), ζ (orange), ξ (gray), and the puckering phase (brown).




