


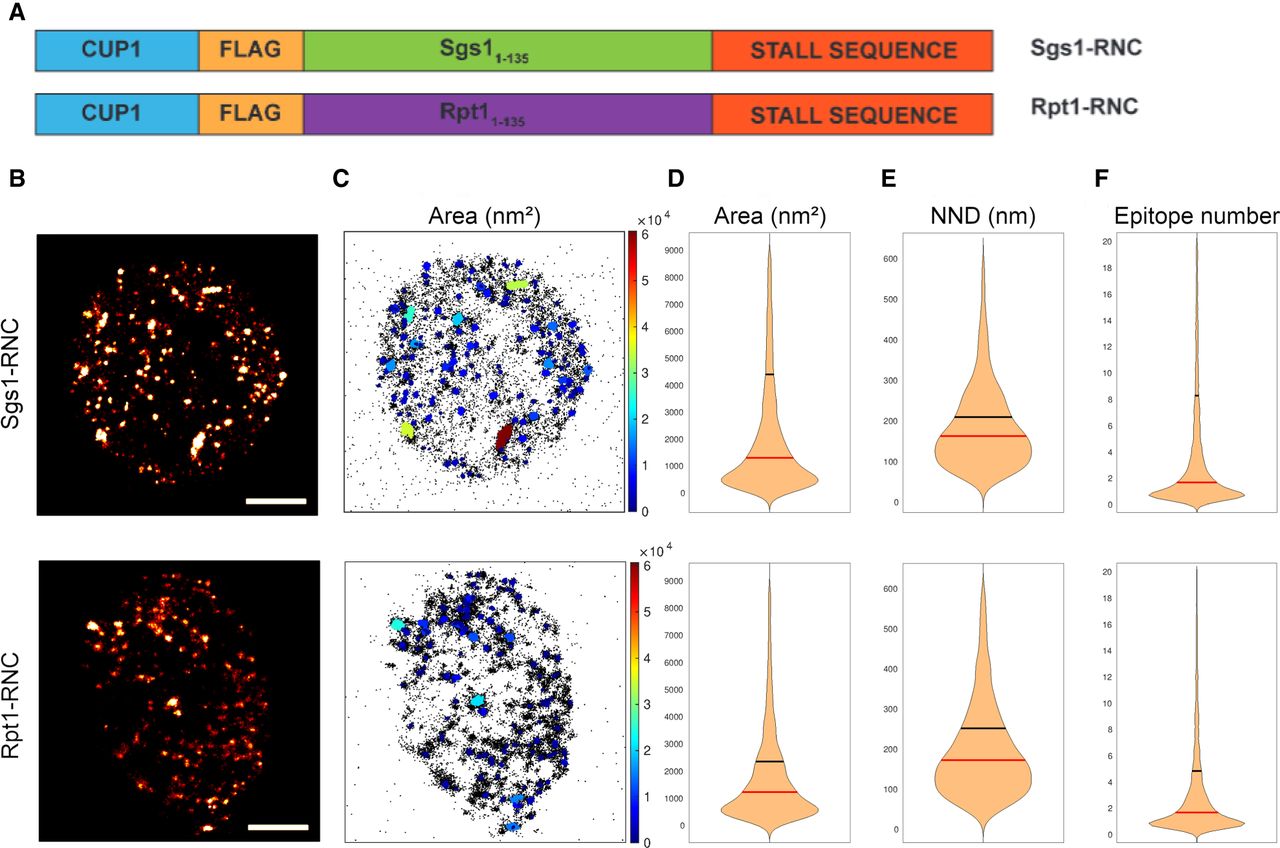
Rpt1- and Sgs1-RNCs form granules in the cytoplasm. (A) Schematic map of the two constructs expressing either Rpt1- or Sgs1-RNC that are identical apart from their first 135 amino acid encoding sequences generated for this study. (B) Two representative reconstructed dSTORM images reveal the granular staining of amino-terminally Flag-tagged Rpt1-RNCs and Sgs1-RNCs. Staining was performed using M2 Flag antibody followed by a secondary Alexa647 antibody. Scale bar: 1 µm. (C) Map of the cluster analyzed localizations via the DBSCAN algorithm. The clusters are color-coded based on the size of their area. Violin plots represent the different distribution of clustered Flag signal area in nm2 (D), of nearest neighbor distance (NND) in nm (E), and the distribution of the epitope number/cluster (F), comparing 36 different Sgs1-RNC expressing cells and 68 different Rpt1-RNC expressing cells, from two (Rpt1-RNC) and three (Sgs1-RNC) independent STORM measurements done on both constructs. Vertical lines represent the median (red) and the mean (black) values.




