


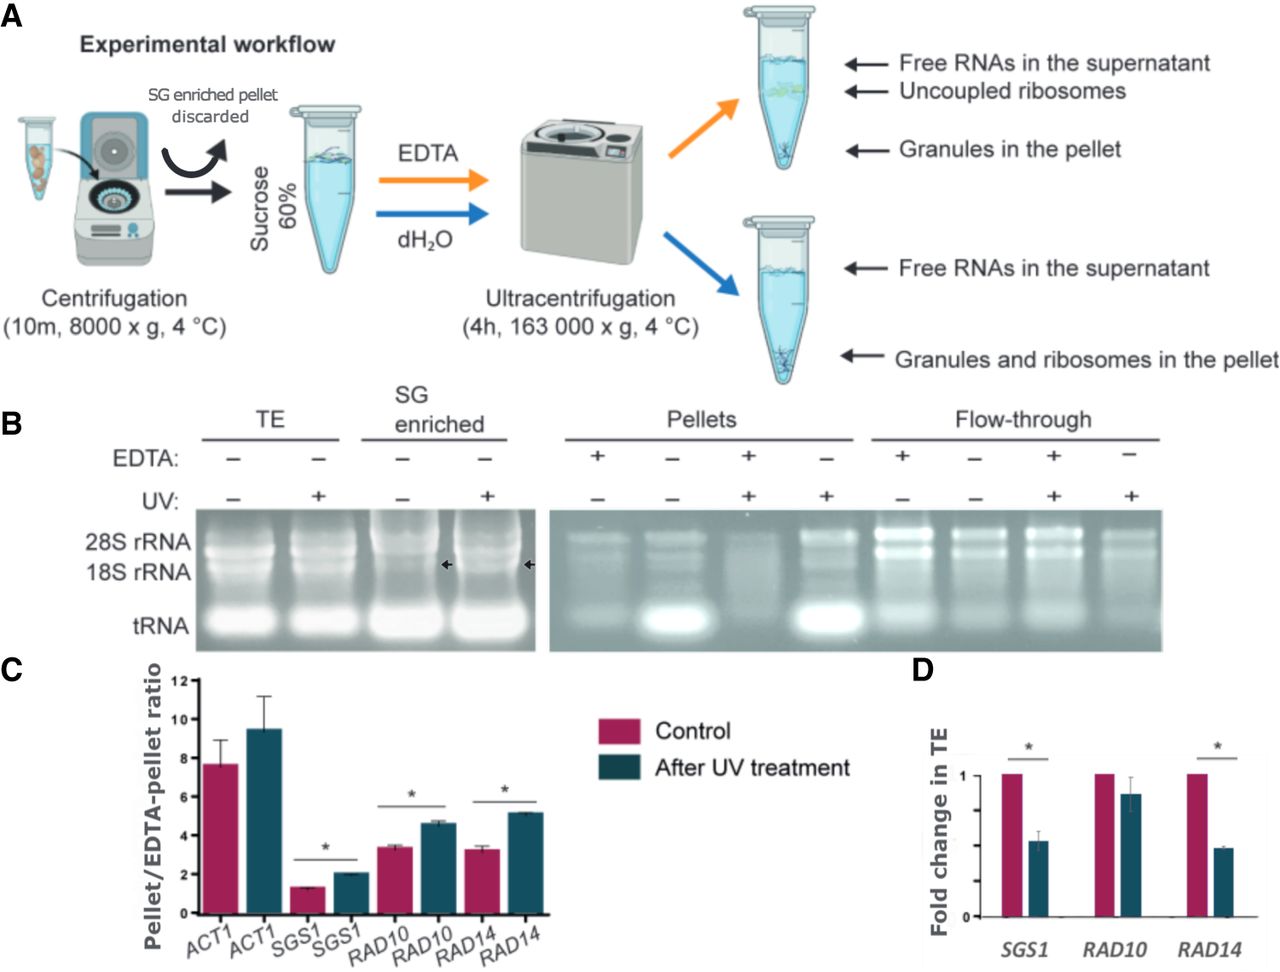
SGS1, RAD10, and RAD14 mRNAs are stored in EDTA-resistant, phase-separated granules. (A) Experimental workflow to pellet granules or granules and polysomes with ultracentrifugation of yeast total protein extracts on 60% sucrose cushions with or without EDTA, respectively. Ultracentrifugation of soluble total extracts on 60% sucrose cushions leads to an enrichment of polysomes in the pellet. If the experiment is performed in the presence of EDTA, the pellet contains no polysomes and is enriched in EDTA-resistant granules. SGs and P-bodies are pelleted before ultracentrifugation and EDTA treatment. (B) Total RNA extracted from yeast cells treated or not with UV were separated on 60% sucrose cushion in the presence or absence of EDTA and separated on 1% nondenaturing agarose gel. (TE) Total extracts. Separated RNA species are highlighted (tRNAs, 18S and 28S rRNAs). Arrows show 18S rRNA species to compare in order to reveal SGs that are provoked by UV and contain small ribosome subunits. (C) RT-qPCR analysis of mRNAs from pellets originating from identical extracts treated with or without EDTA. Results are expressed as pellet/EDTA-pellet ratio of mRNA quantities. Change in ACT1, SGS1, RAD10, and RAD14 and pellet/EDTA-pellet ratio of mRNA quantities after the UV treatments are shown next to the same ratio measured in the untreated control. Values in the chart represent the average of two independent measurements of biological replicates with error bars representing standard deviation. Statistical significance is determined by a two-tailed Student's t-test ([*] P < 0.05, [**] P < 0.01). (D) RT-qPCR analysis of mRNAs from the total extract of control and UV-treated yeast cells. Fold change in mRNA quantities in UV-treated samples are compared to the control in each case, and ACT1 mRNA was used for normalization. Statistical significance is determined by a two-tailed Student's t-test ([*] P < 0.05).




