


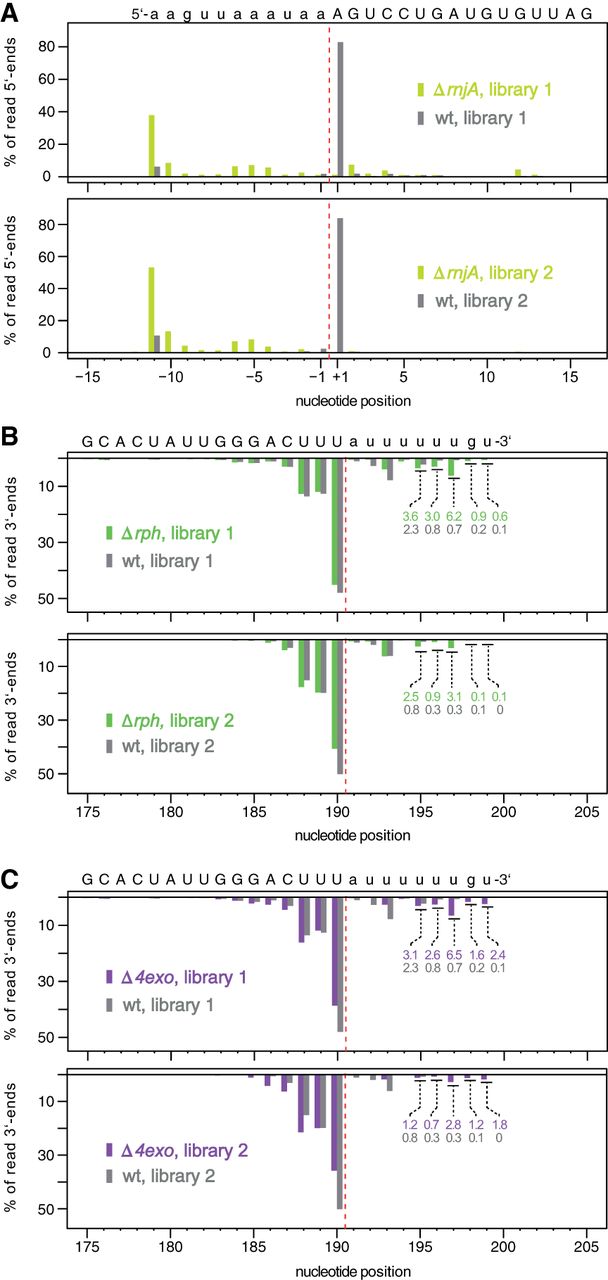
Representative 6S-1 RNA 5′- and 3′-end read profiles for the indicated strains and libraries, given as the percentage of all mapped 5′- or 3′-ends. (A) 5′-end read distribution in the region between position +1 and −15, illustrated by bars pointing upward, and shown for libraries 1 and 2 of the ΔrnjA strain (light green bars) and the wt strain (gray bars). (B,C) 3′-end read distribution in the region covering nt 180 and 199, illustrated by bars pointing downward. Nucleotide sequences are given above each graph, with capital letters indicating nucleotides of the mature 6S-1 RNA and lower case letters nucleotides present in precursor molecules. The percentages of 3′-ends at positions 195–199 are given below the bars for the Δrph (B, green numbers) and Δ4exo (C, purple numbers) libraries, and underneath for the corresponding wt library (gray numbers in B and C).




