


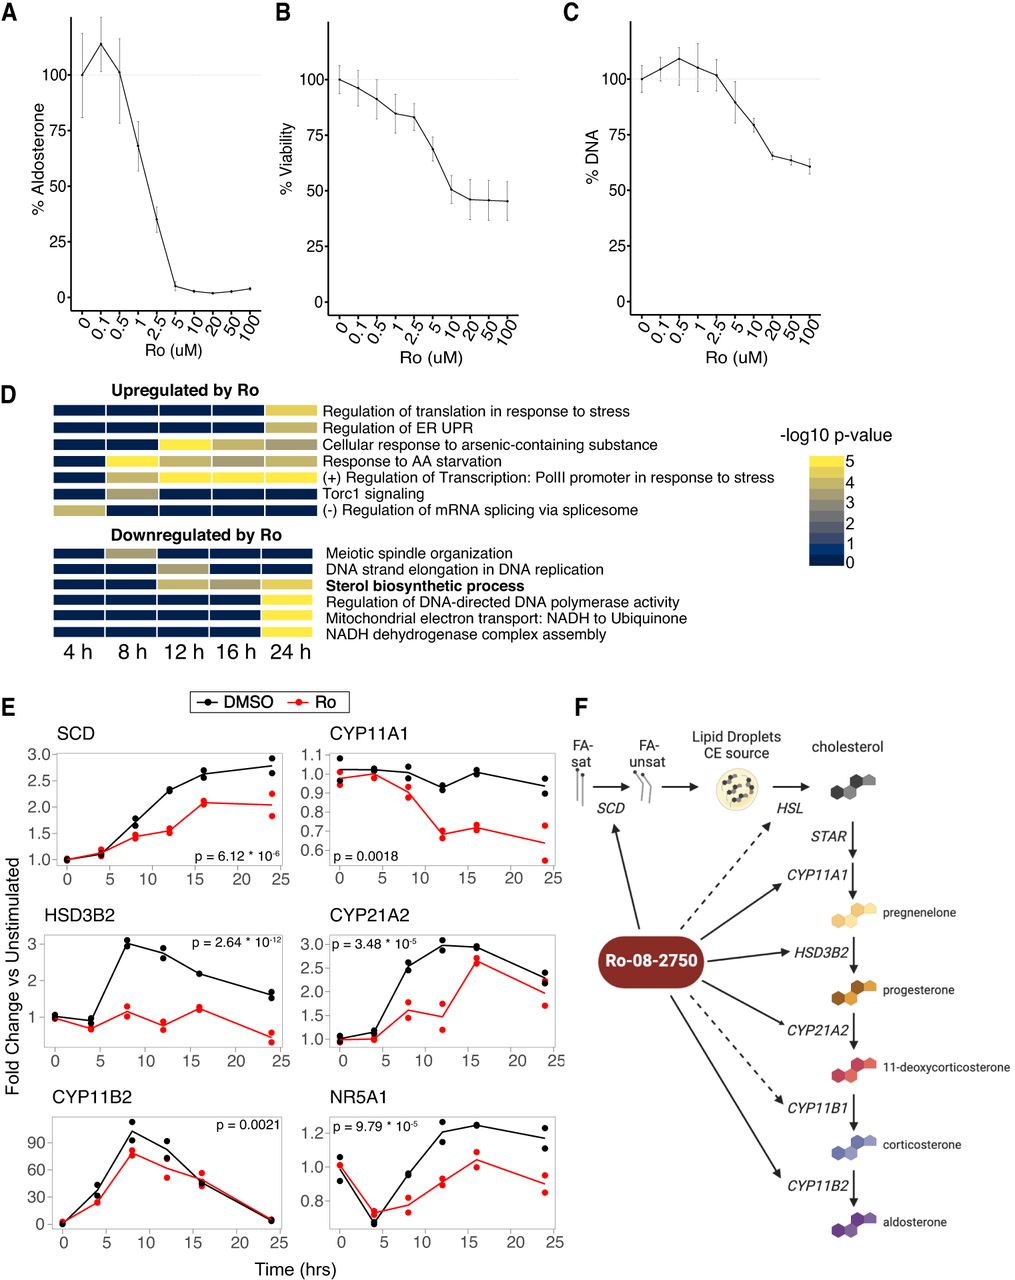
Ro inhibits steroidogenesis. Dose-dependent effects of Ro on the percent of aldosterone (A), cell viability (PrestoBlue) (B), and DNA content (FluoReporter) (C) relative to DMSO in H295R cells stimulated with 10 nM Ang II. Error bars indicate SD from up to three independent rounds of experiments, each containing six independent replicates. (D) Heatmap representing selected enriched BP ontology terms in genes differentially expressed after Ro treatment during AngII stimulation time course (see Supplemental Fig. 1C,D for full results). (E) Fold change and P-values of mRNA levels compared with unstimulated controls for DMSO (black) or 5 µM Ro (red) treated H295R cells at multiple times post-AngII stimulation (10 nM). The likelihood ratio test was used to calculate P-values. (F) Model depicting the regulation of genes involved in key steps steroidogenesis by Ro. Solid lines show genes significantly down-regulated upon Ro treatment.




