


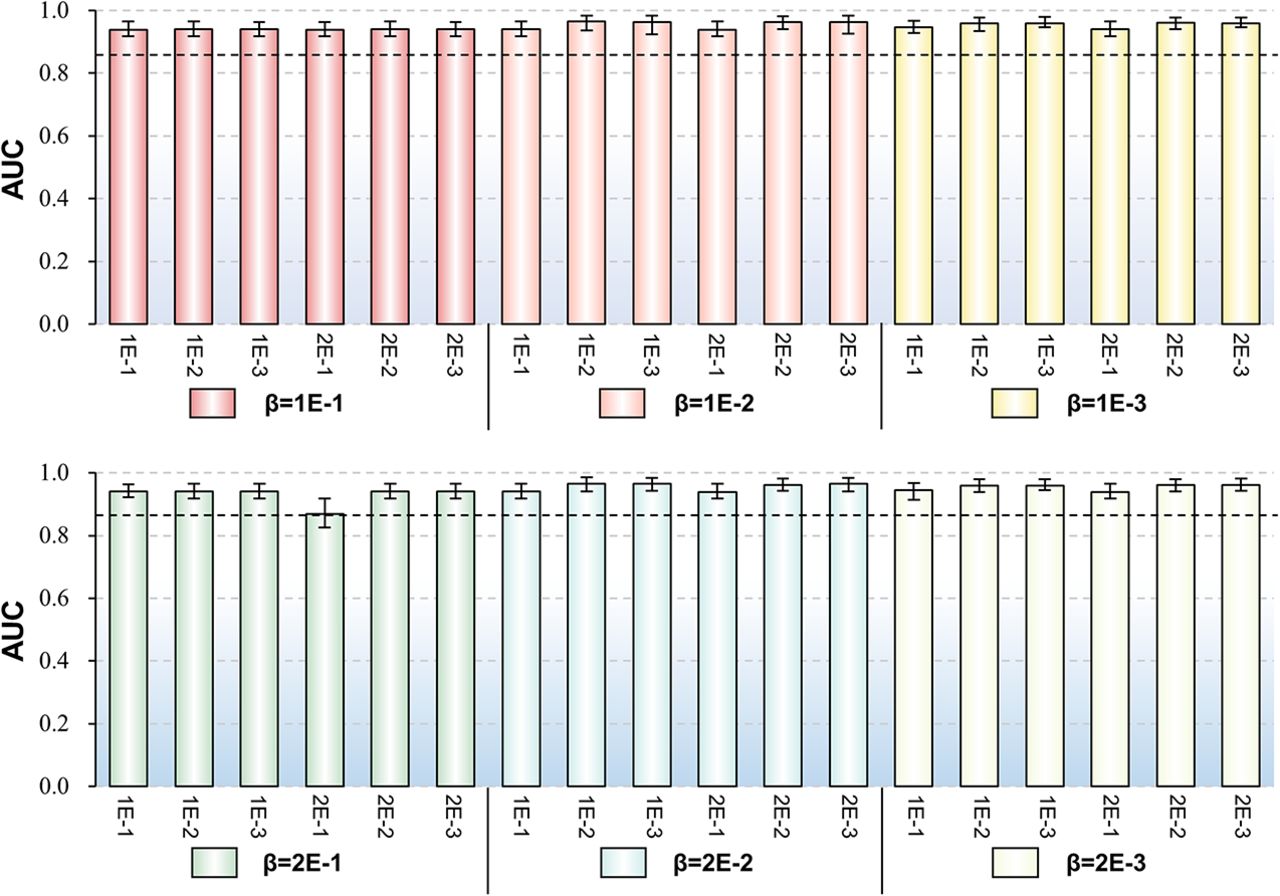
FIGURE 1.
The influence of parameters on the performance of iSnoDi-LSGT predictor via 10-fold cross-validation on Sbenchmark. Different bar charts denote different AUC values based on all predicted results via 10-fold cross-validation on Sbenchmark. X-axis, y-axis, and different color bars represent the values of γ, AUC, and β, respectively. Error bars represent deviation across the different 10-fold cross-validation on Sbenchmark. The black dotted line denotes a horizontal line at the level of the minimum value.




