


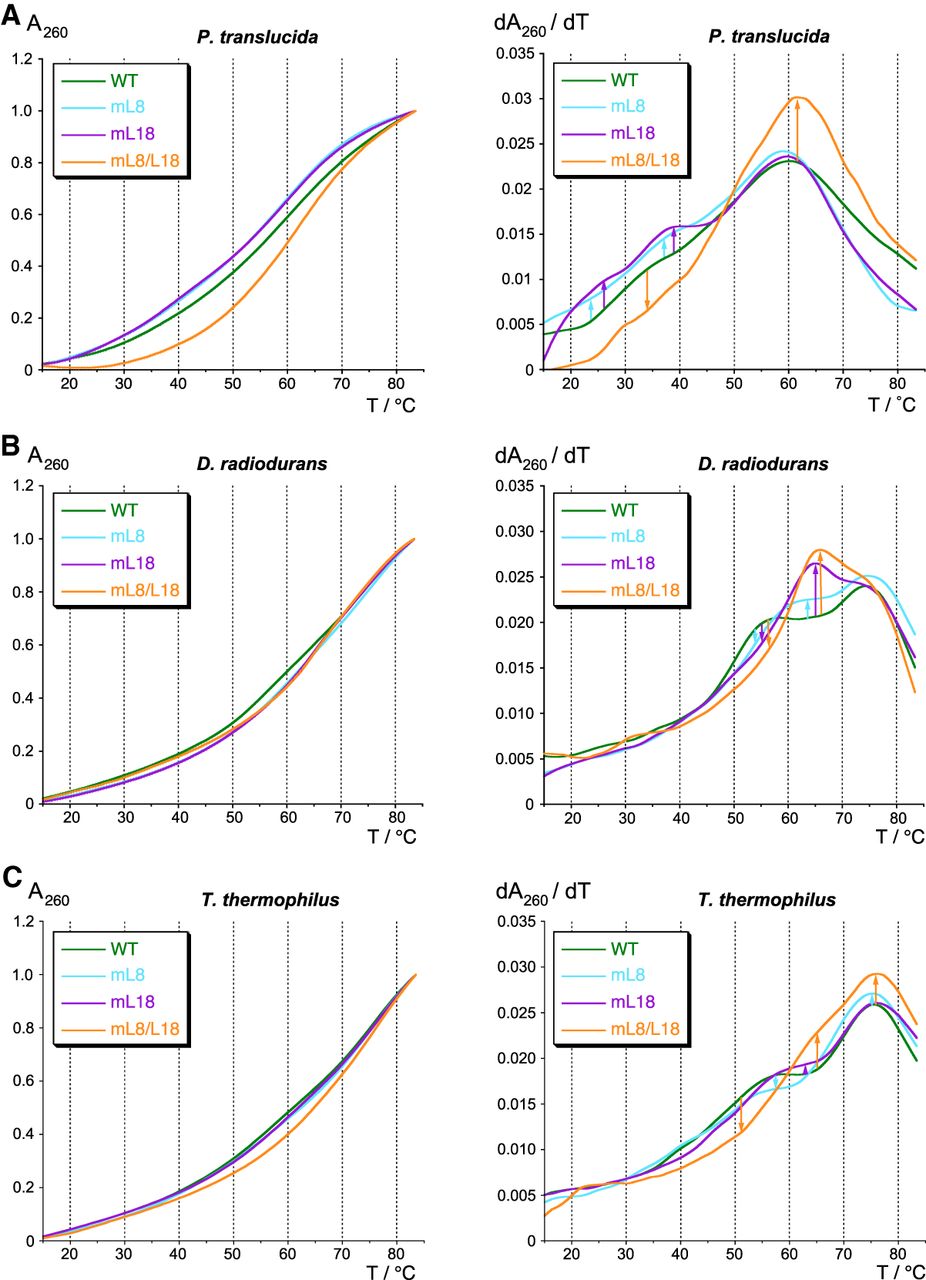
FIGURE 2.
UV absorbance (left) and derivative (right) melting profiles for Ptr (A), Dra (B), Tth (C) P RNAs and mutants thereof, measured in 10 mM sodium cacodylate pH 7.0, 0.5 mM EDTA, and 100 mM NaCl (RNA concentration 25 nM, averages of three to four curves each). Changes in the melting transitions between wild-type (WT) and corresponding mutant P RNAs are indicated by vertical arrows in the first derivative plots on the right.




