


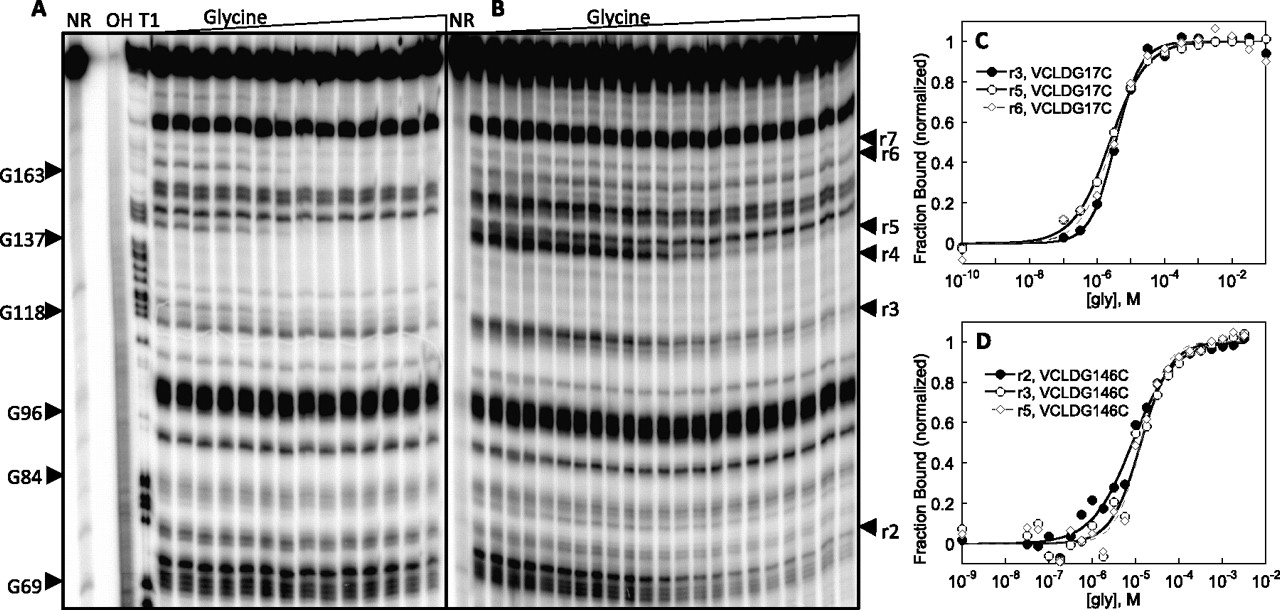
FIGURE 6.
(A,B) The in-line probing gel images of VCLDG17C and VCLDG146C, respectively. NR, T1, and OH represent no reaction, partial digestion with RNase T1, and partial digestion with alkali, respectively. r2–r7 indicate regions defined in Table 2. (C,D) The representative semi-log plots of the normalized fraction of RNA bound versus glycine concentration for VCLDG17C (r3, r5, and r6) and VCLDG146C (r2, r3, and r5), respectively.




