


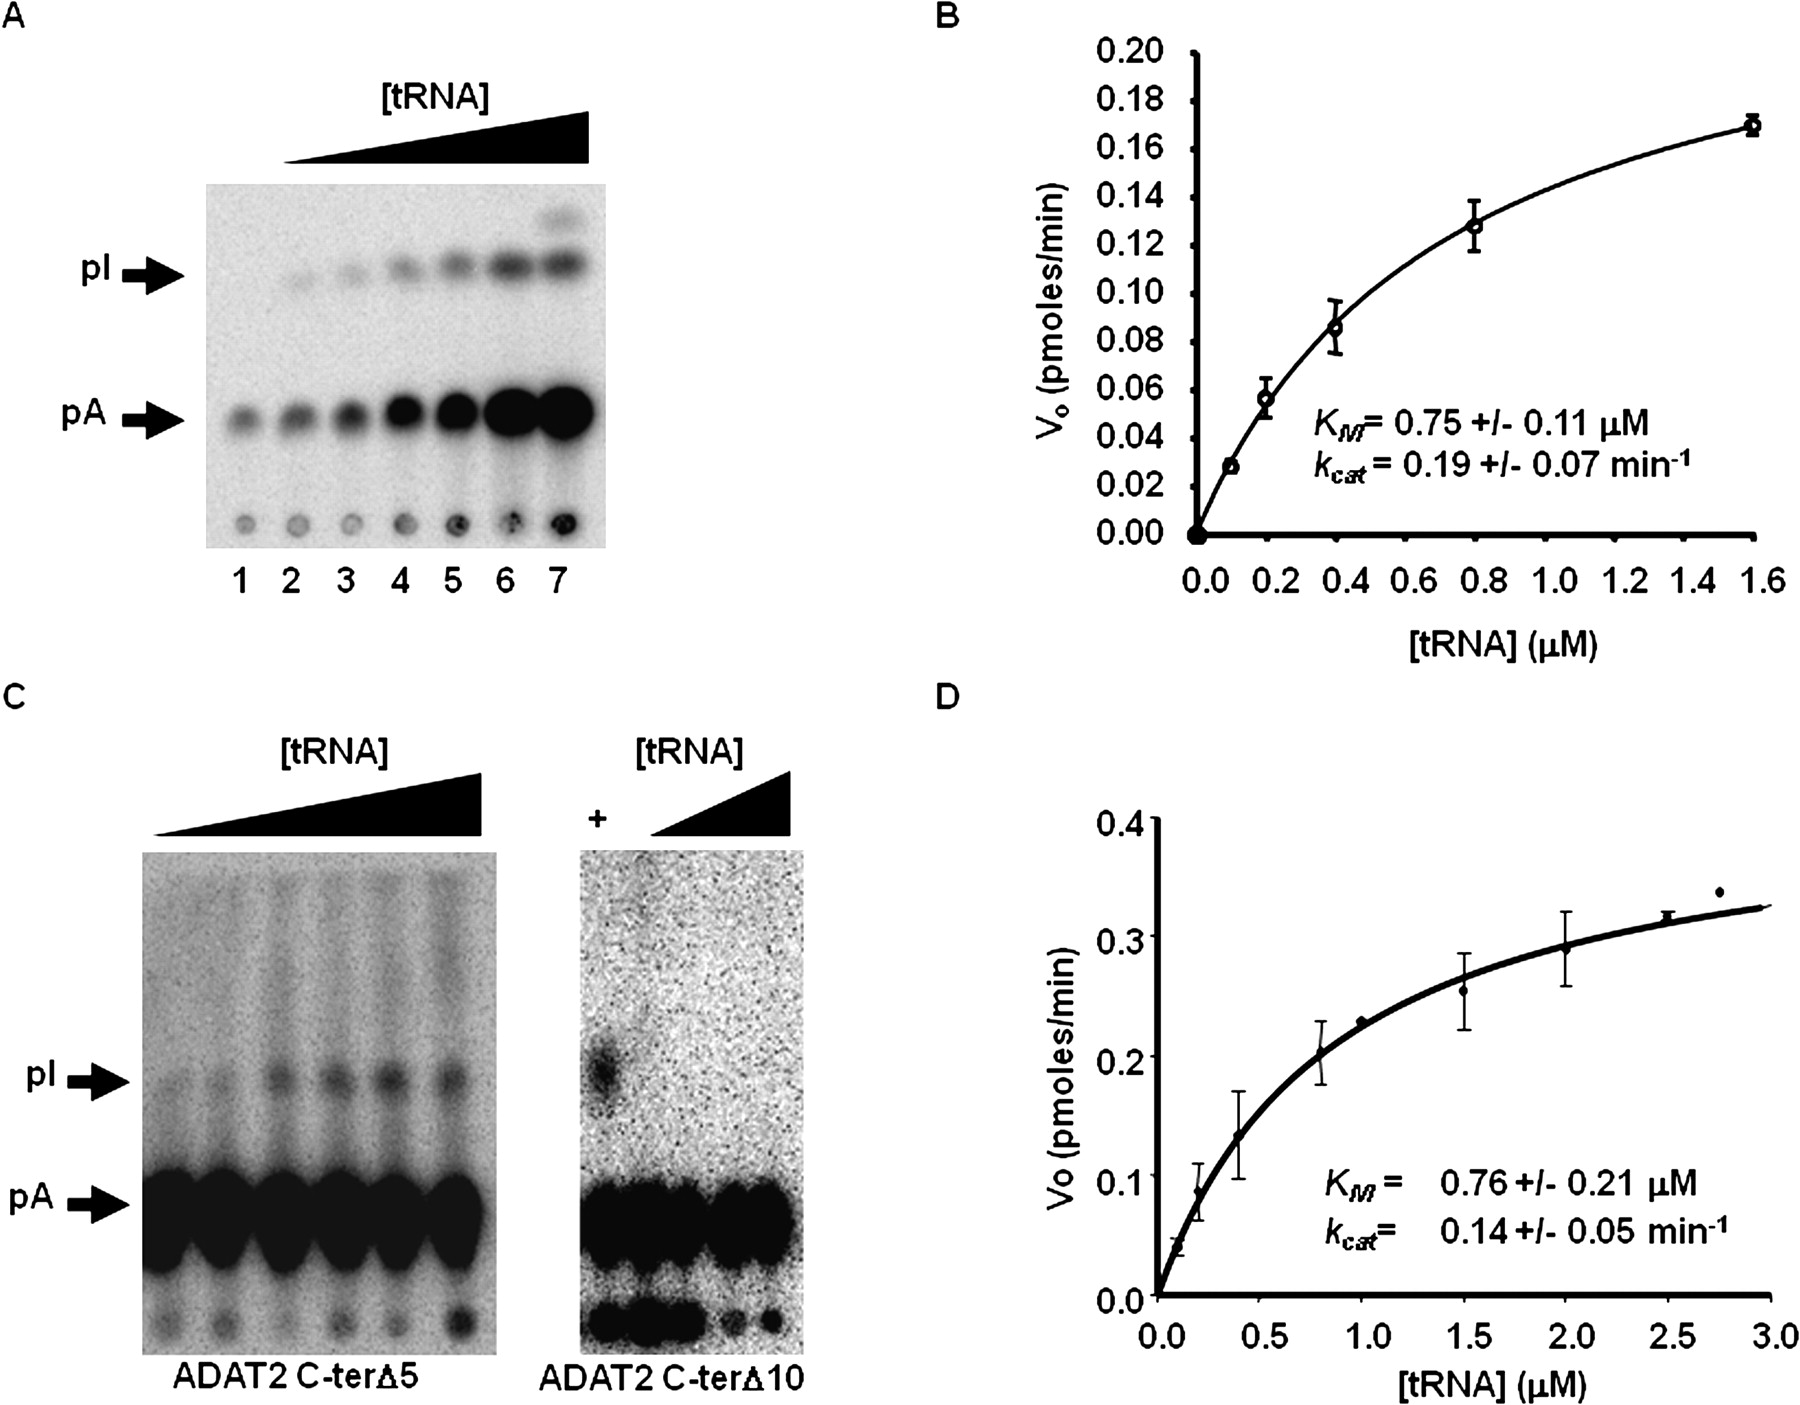
Steady-state kinetic analysis of wild-type TbADAT2/3 and variants. (A) A representative one-dimensional thin-layer chromatography (TLC) analysis of the reaction products. pA and pI denote the migration of unlabeled 5′-AMP (pA) and 5′-IMP (pI) used as TLC markers and visualized by UV shadowing (not shown). The fraction of pA converted into pI during each reaction was calculated by dividing the amount of radioactive pI produced by the total (pA + pI); this value was then used to calculate the picomoles of 5′-IMP produced. A no-enzyme control was routinely used for background subtraction. (B) The initial velocity (Vo) is plotted as a function of substrate concentration given in μM. The data were fitted by nonlinear regression to the Michaelis–Menten equation using the SigmaPlot kinetic software. (C) Similar assays were performed with the two C terminus deletion mutants (ADAT2 C-terΔ5 and ADAT2 C-terΔ10) as indicated. A plus sign (+) refers to a reaction in which the radioactive tRNA substrate was incubated with wild-type TbADAT2/3 as a positive control. The black triangles refer to increasing, saturating concentrations of tRNA used in the assay (0.1, 0.2, 0.4, 0.8, 1.5, 2.0, 2.5, and 2.8 μM). (D) A plot of initial velocity vs. substrate concentration was used to derive the KM and kcat values as in B.




