


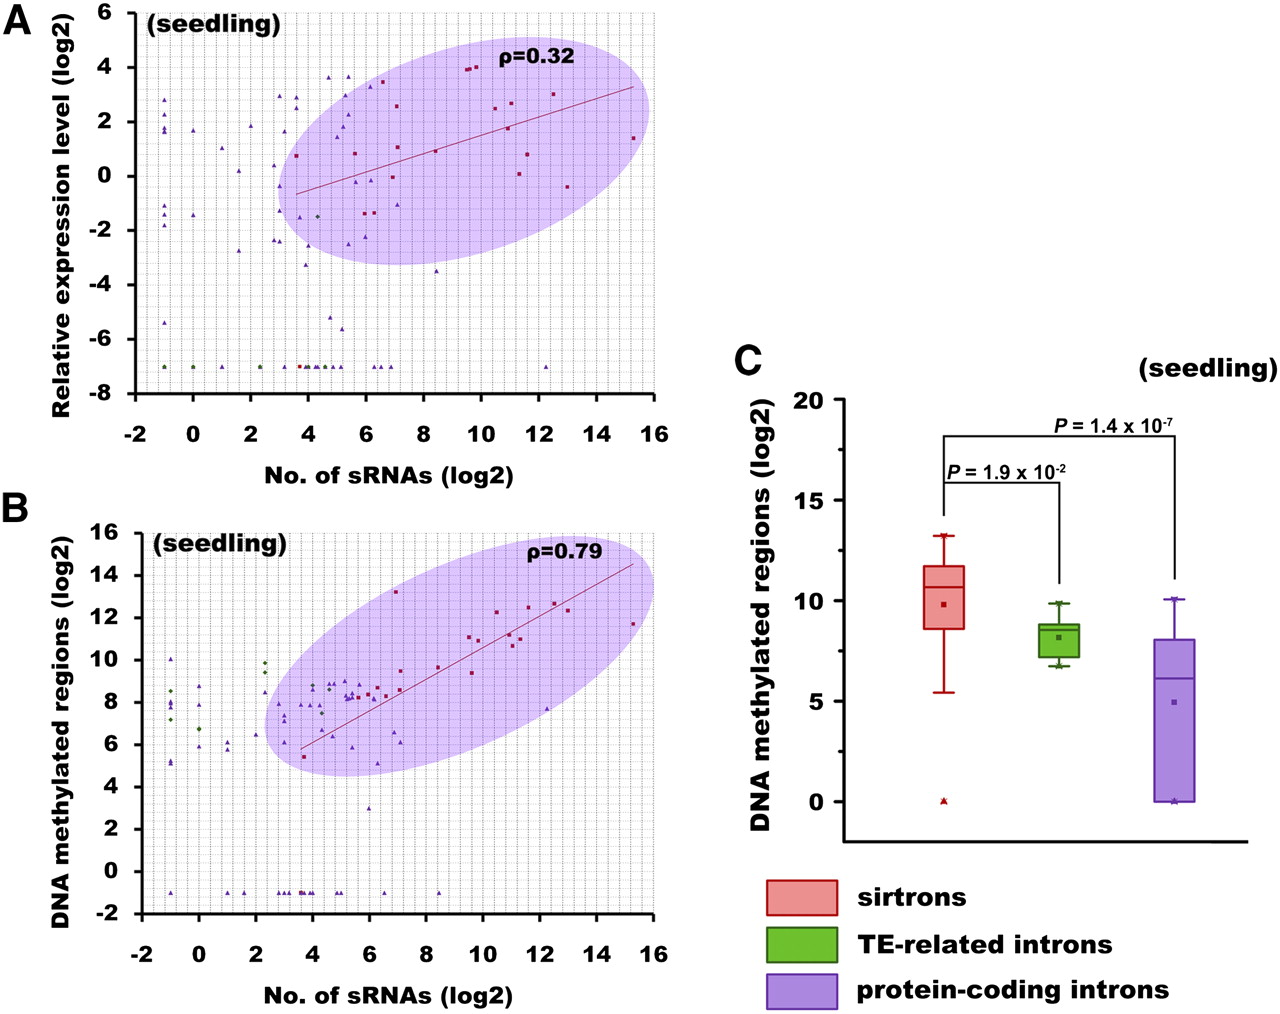
Sirtronic siRNAs are coexpressed with their host genes and direct DNA methylation in cis. (A) Correlation between the number of the intronic sRNAs and the expression levels of their host genes. (B) Correlation between the sRNA generation in lhp introns and DNA methylation at their own loci. The sRNAs and DNA methylated regions were counted for each lhp intron. For both A and B, scattered plots show log2-scaled data for each lhp intron. If the corresponding data were not detected (with “0” value unsuitable for log2-transforming), we uniformly used a constant number (smaller than lowest log2-scale detected value; “−1” for sRNA/DNA methylation data and “−7” for gene expression data) instead. The oval includes nearly all the sirtrons (red) within it, and the Spearman's rank correlation coefficient (ρ) for each category is shown. TE (transposable element)–related lhp introns (green); protein-coding lhp introns (non-sirtrons) (purple). (C) Box plots illustrating the significantly different DNA methylation pattern (log2-transformed) between the sirtronic sRNA and non-sirtronic ones, as colored in A and B. The bottom and top of the box are the 25th and 75th percentile, respectively. (Filled triangles) The smallest (upward triangles) and largest observation (downward triangles); (filled rectangles) the mean value. The significant P-values between the two groups are shown above. (TE) Transposable element.




