


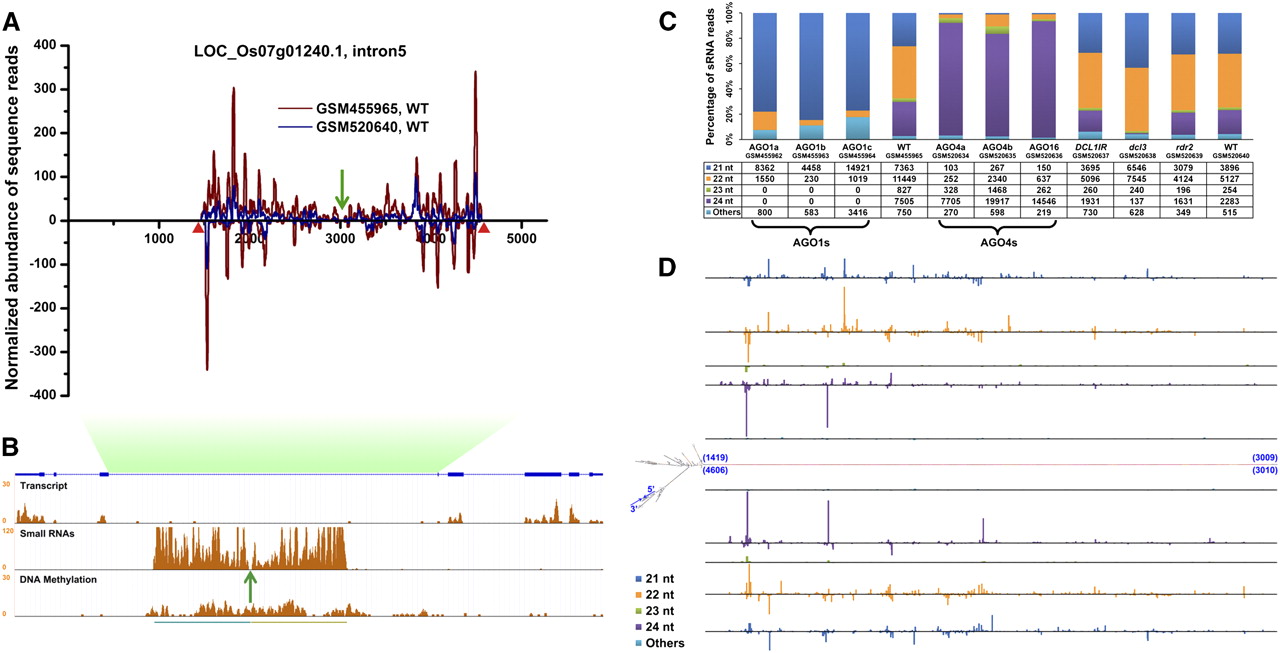
Long-hairpin-structured introns (lhp introns) producing an abundance of short interfering RNAs (siRNAs) from the sense strand. One example of this kind of intron, the fifth intron of LOC_Os07g01240.1, is shown. (A) Profiling of siRNAs derived from this intron. The normalized siRNA abundance in each library was plotted at 1-base resolution. The green arrows indicate the predicted terminal loop of the folded region, and the red triangles indicate the boundary of the hairpin. In total, 39,969 sequence reads (representing 4801 distinct siRNA sequences) were generated from the intron, with 27,060 (67.7%) and 12,909 (32.3%) mapped to the sense and the antisense strands, respectively. Of these sequences, 39,959 (>99.9%, 4793 distinct siRNA sequences) could be unambiguously mapped to the stem region of the hairpin, with 20,813 (52.1%) and 19,146 (47.9%) on the 5′ and 3′ arms, respectively. (B) Gene and siRNA expression, and DNA methylation patterns of LOC_Os07g01240.1. The long complementary stem regions are highlighted by lines at the bottom (left line indicates the 3′ arm and the right one the 5′ arm). Please note that the gene model is shown in reversed direction. (C) The size distribution of the siRNAs derived from this intron. The percentage of siRNAs in each size from the 11 data sets is shown in bar charts, and the number of sequence reads is listed in the table. Three AGO1 and three AGO4 family members are indicated below. For both A and C, note that the two wild-type (WT) libraries (GSM455965—reference library for AGO1s, and GSM520640—reference library for AGO4s, DCL1IR, dcl3, and rdr2) were from two independent experiments. (D) Deep insight into siRNA generation along the stem regions of the long hairpin. SiRNA populations in each size category (as colored by the listed key, the same as in B from the 5′ arm [top] and 3′ arm [bottom]) were plotted after alignment by the 5′ terminus. The positions of the stem regions along the predicted secondary structure (middle) are shown in parentheses.




