


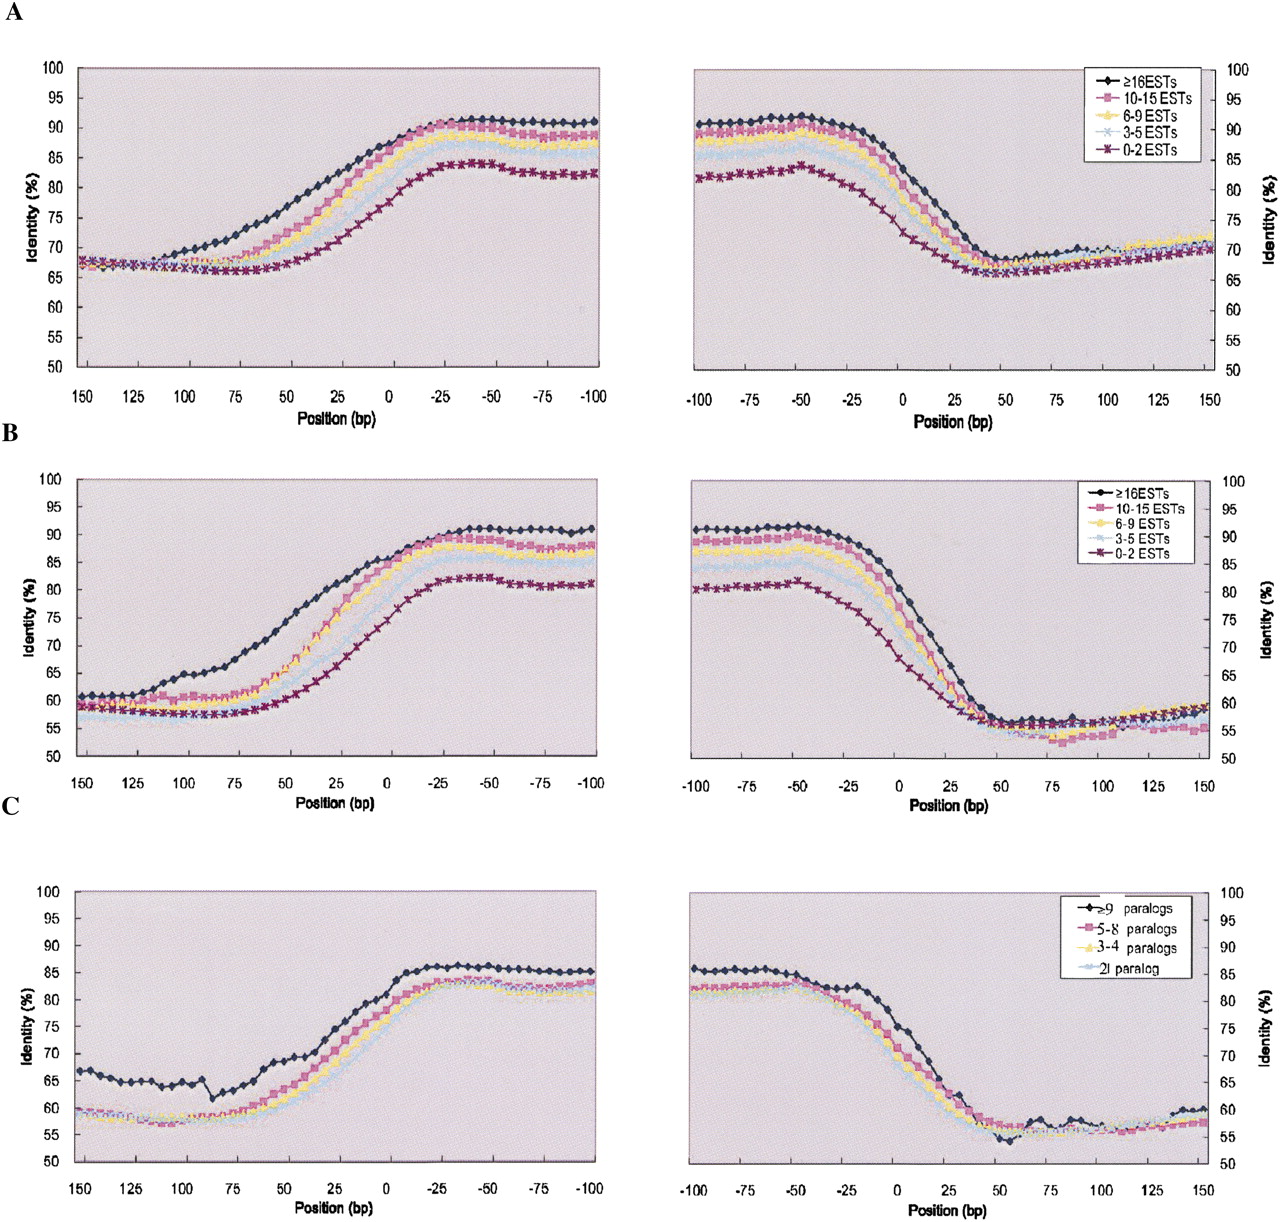
Comparative analysis of gene-flanking sequences. Sequence identity was calculated for windows of 50 bp slipped by 5 bp relatively to the start (left columns) and stop (right columns) codons of genes evolved from recent duplicates. Start and stop codons are indicated by positions 0. (A) Sequences were split into five classes according to the number of associated ESTs: 0-2 (20,406), 3–5 (1,746), 6–9 (689), 10–15 (462), or ≥16 (749) as reported in reference (Aury et al. 2006). (B,C) Intergenic DNA sequences >150 bp were selectively retained for these analyses. Sequences were split into classes according to (B) the number of associated ESTs 0-2 (9,038), 3–5 (712), 6–9 (284), 10–15 (197), and ≥16 (324) or (C) the number of ohnologs in the corresponding OHSets: 2 (5,576), 3–5 (3,980), 5–8 (1,019), or ≥9 (52). Sequences identities reached lower levels 50 bp downstream from stop codons and 80–115 bp upstream of start codons. The higher the number of associated ESTs, the higher the identity of the gene-flanking sequences.




