


In vivo detection of RNA-binding protein interactions with cognate RNA sequences by fluorescence resonance energy transfer
- Martina Huranová1,
- Joseph A. Jablonski2,
- Aleš Benda3,
- Martin Hof3,
- David Staněk1 and
- Massimo Caputi2
- 1Department of RNA Biology, Institute of Molecular Genetics, Academy of Sciences of the Czech Republic, CZ-14220 Prague 4, Czech Republic
- 2Department of Basic Science, Florida Atlantic University, Boca Raton, Florida 33431, USA
- 3J. Heyrovsky Institute of Physical Chemistry, Academy of Sciences of the Czech Republic, 182 23 Prague 8, Czech Republic
Abstract
Expression of the nascent RNA transcript is regulated by its interaction with a number of proteins. The misregulation of such interactions can often result in impaired cellular functions that can lead to cancer and a number of diseases. Thus, our understanding of RNA–protein interactions within the cellular context is essential for the development of novel diagnostic and therapeutic tools. While there are many in vitro methods that analyze RNA–protein interactions in vivo approaches are scarce. Here we established a method based on fluorescence resonance energy transfer (FRET), which we term RNA-binding mediated FRET (RB-FRET), which determines RNA–protein interaction inside cells and tested it on hnRNP H protein binding to its cognate RNA. Using two different approaches, we provide evidence that RB-FRET is sensitive enough to detect specific RNA–protein interactions in the cell, providing a powerful tool to study spatial and temporal localization of specific RNA–protein complexes.
Keywords
INTRODUCTION
Up to 40% of mutations leading to genetic diseases and cancer cause post-transcriptional misregulation of gene expression that often correlates with splicing defects, RNA editing errors, and altered mRNA stability or localization. Several diseases such as frontotemporal dementia with parkinsonism (FTDP) (D'Souza et al. 1999) or spinal muscular atrophy (SMA) (Lorson et al. 1999) originate from a single nucleotide mutation in the pre-mRNA, resulting in an imbalanced ratio between alternatively spliced protein variants. A majority of these mutations are speculated to weaken critical interactions with cellular splicing factors. The identification of such factors is often a cumbersome process that requires in vitro assays and several multiple biochemical purification steps. Furthermore, the complex set of interactions within the cellular environment can hardly be mimicked in vitro. Within the cell, RNA–protein interactions may be influenced by (1) the relative concentrations of competing factors; (2) the secondary structure of the target RNA, which might be influenced by its interaction with a number of RNA-binding proteins; (3) the phosphorylation state of the RNA binding protein; (4) ion concentrations; and (5) intracellular localization.
hnRNP H is the prototypical member of a highly homologous, ubiquitously expressed protein family of RNA-binding proteins constituted by hnRNPs H, H′, F, 2H9, and GRSF-1. These proteins have been shown to regulate several aspects of mRNA biogenesis. In particular, members of this protein family have been shown to activate splicing in several systems (Min et al. 1995; Chou et al. 1999; Hastings et al. 2001; Caputi and Zahler 2002; Garneau et al. 2005; Han et al. 2005; Marcucci et al. 2006; Schaub et al. 2007), while acting as splicing repressors in others (Chen et al. 1999; Fogel and McNally 2000). Members of the hnRNP H family share similar binding specificities for the consensus sequence DGGGD (where D is A, G, or C) (Schaub et al. 2007). NMR studies also indicate that hnRNP F, one of the hnRNP H family members, interacts with a poly(G) sequence via two quasi-RNA-recognition motifs (qRRMs) (Dominguez and Allain 2006). Genomic studies have shown that G-runs are found preferentially in intronic sequences immediately flanking the splice sites and appear to facilitate splicing of the intron (McCullough and Berget 1997; Yeo et al. 2004). Nevertheless, functional studies indicate that mutation of only a few of the potential hnRNP H–binding sites within a gene transcript may alter splicing (Schaub et al. 2007), suggesting that interaction with other regulatory elements and/or proper positioning within a higher-order RNA structure may be required for splicing control by hnRNPs of the H family. Thus, the ability of hnRNP H to functionally interact with a target sequence in vivo appears to differ from its ability to bind a RNA substrate in vitro. The same is likely to be true for most RNA-binding proteins, which recognize their target RNA in a complex environment where several other factors may compete or aid in the interaction and structural elements within the RNA itself might alter the stability of the RNA–protein complex. Furthermore, the interaction between a given RNA-binding protein and its target may drastically change in response to intracellular signaling and changes in key physiological conditions.
A wide array of techniques has been developed to study the spatial distribution and interactions of proteins in cellular systems. More recently, single mRNA molecules, tagged with a fluorescent reporter, have been visualized and their localization in living cells studied (Shav-Tal et al. 2004; Rodriguez et al. 2006, 2007; Boireau et al. 2007), while other reporter systems allowed for the direct visualization of RNA transcription (Darzacq et al. 2007; Endoh et al. 2008). However, specific techniques aimed at the direct detection of protein–RNA interactions within cells need to be fully developed. Recent studies have utilized fluorescence resonance energy transfer (FRET) and fluorescence complementation (TriFC) to study the interactions between the RNA-binding proteins PTB, Raver1, FMRP, and IMP1 and their cognate RNA targets (Rackham and Brown 2004; Lorenz 2009). Although useful, such techniques have limitations, as they lack either specificity for the recognition by the protein of a specific mRNA (the latter) or the ability to detect temporal and spatial regulation (the former).
FRET is a photophysical phenomenon in which energy is transferred between two appropriate fluorophores called donor and acceptor that are in proper orientation and distance (usually, <10 nm). In cell biology, fluorophores are often attached to proteins, and their proximity is achieved by interaction of tagged proteins. However, the tagged proteins do not have to interact directly. It is often enough when FRET partners are part of the same macromolecular complex, as for the spliceosome where FRET was successfully used for measuring dynamic protein–protein interactions between splicing factors (Staněk and Neugebauer 2004; Chusainow et al. 2005; Ellis et al. 2008; Rino et al. 2008). In this study, we describe a novel technique to detect specific RNA–protein interactions within cells by FRET-FLIM utilizing the MS2 coat protein–RNA operator interaction as a molecular marker. This technique, which we term RNA-binding mediated FRET (RB-FRET), allows for quantitative and dynamic analysis of the association of a given RNA-binding protein with its cognate RNA target inside cells and overcomes the shortcomings of in vitro studies and previous in vivo techniques.
RESULTS
Our basic experimental approach that we carried out is summarized in Figure 1. The RNA-binding protein of interest is tagged with an enhanced cyan fluorescent protein (ECFP) and utilized as the FRET donor, while the bacteriophage MS2 coat protein is tagged with the enhanced yellow fluorescent protein (EYFP) and utilized as the FRET acceptor. A target RNA containing the binding site for the protein of interest in the proximity of the high-affinity MS2 RNA operator is generated by a third construct. Upon simultaneous binding of the protein of interest-ECFP and MS2-EYFP fusion protein to the target RNA proximity of the donor ECFP and the acceptor EYFP will result in FRET.
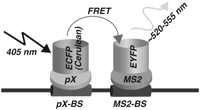
Schematic representation of the strategy utilized to visualize RNA–protein interaction inside cells.
Utilizing the outlined strategy, we analyzed the binding of hnRNP H to its putative RNA-binding site. The hnRNP H was tagged at its N terminus with ECFP, obtaining the clone pECFP-hnH (Fig. 2A), while the bacteriophage MS2 coat protein gene was tagged at its C terminus with EYFP (pMS2-EYFP). Expression of the fusion proteins ECFP-hnH and MS2-EYFP was confirmed by Western blot analysis (Fig. 2C). Antibodies against hnRNP H, MS2, and ECFP/EYFP indicated that the fusion proteins were properly expressed.
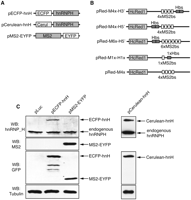
Validation of vector expression utilized in this study. (A) Schematic representation of the protein expression vectors utilized in the study. (B) Schematic representation of the constructs generating RNA substrates utilized in the study. (C) Expression of the key fusion proteins used in the study. HeLa cells were transfected by the indicated expression plasmid (top). The total cell lysates were analyzed by Western blot with the indicated antibody. Identity of the various fusion proteins is indicated on the right. Endogenous hnRNP H is also marked.
Next we obtained a series of constructs expressing mRNA substrates carrying the binding sites for hnRNP H and the MS2 coat protein by inserting either one or two copies of the high-affinity hnRNP H binding site (GGGGA) (Schaub et al. 2007) in proximity of one, four, or six copies of the sequence-specific stem–loop recognized by the MS2 coat protein (Fig. 2B). The binding sites separated by a 50-nucleotide (nt) spacer sequence were inserted within the 3′ UTR of the HcRed1 gene. Expression of the HcRed1 gene allowed for control of expression of the target mRNA.
To show that the ECFP-hnH and MS2-EYFP fusion proteins can be efficiently recruited onto the target RNAs in vitro, we utilized an RNA affinity chromatography (RAC) technique that allows for efficient detection of RNA–protein interactions in complete cell extracts. RNA substrates containing the sequences within the 3′-UTR of the pRed-M4x-H3′ and pRed-M4x constructs and a control sequence derived from the parental pHcRed1-C1 vector were synthesized in vitro (Fig. 3A). RNAs were than incubated with total extracts from HeLa cells transfected with pMS2-EYFP, pECFP-hnH, or the combination of the two. Proteins specifically bound to the bait RNAs were than eluted and analyzed by Western blotting. Western blot analysis of the eluate shows that both endogenous hnRNP H and the fusion protein ECFP-hnH are recruited by the M4x-H3′ RNA, containing both the MS2 coat protein and the hnRNP H consensus binding site (Fig. 3B, lanes 2–4). The RNA substrate carrying only the MS2 coat protein binding sites showed a lower affinity for both the ECFP-hnH fusion protein and the endogenous hnRNP H (Fig. 3B, lanes 5–8). The MS2-EYFP fusion protein was efficiently recruited by the substrates containing the MS2 coat protein RNA binding sites (Fig. 3B, lanes 3,4,7,8). The control RNA sequence (RNA_Cont) exhibited only a residual affinity for the fusion proteins present in the cell extracts; this was likely due to the low stringency washing steps utilized in the elution process.
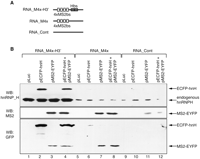
The fusion proteins specifically bind their target RNA in vitro. (A) Schematic representation of the RNA substrates utilized in the RNA affinity chromatography (RAC) assay. (B) Analysis of the fusion proteins bound to the substrate RNAs by RAC. (Top) The substrates schematically represented in A were covalently linked to agarose beads and incubated in extracts derived from HeLa cells transfected with the indicated plasmids. Proteins bound to the substrates were eluted and immunoblotted with the indicated antibodies. Identity of the various fusion proteins is indicated on the right.
Next, we tested the ability of RNA-binding-mediated FRET (RB-FRET) to generate efficient FRET signals between the ECFP-hnH donor and the MS2-EYFP acceptor when the two molecules were brought into proximity by their association with their target RNA sequences. HeLa cells were cotransfected with pMS2-EYFP, pECFP-hnH, and the indicated pRed vector (Fig. 4). Expression of the transfected plasmids was monitored by visualizing the ECFP, EYFP, and HcRed1 tags (Fig. 4A). FRET signals between ECFP-hnH and MS2-EYFP pairs were measured by the acceptor photobleaching method that relies on detection of quenched donor fluorophores (Bastiaens et al. 1996; Karpova et al. 2003). FRET was detected as an increase of the donor (ECFP) fluorescence after acceptor (EYFP) photodestruction (Fig. 4A). As a positive FRET control, we examined the Cajal-body-specific protein p80/coilin, which has previously been shown to interact with itself both in vitro and in vivo (Hebert and Matera 2000). The coilin N terminus was tagged with either ECFP or EYFP (ECFP-p80, EYFP-p80), and pairs of tagged variants were coexpressed in HeLa cells (Fig. 4B). FRET efficiency between MS2-EYFP/ECFP-hnH correlated with expression of substrate RNA containing both MS2 and hnRNP H–binding sites and was comparable to the coilin positive control. FRET signal was significantly lower when MS2-EYFP/ECFP-hnH were coexpressed with a RNA substrate containing MS2-binding sites but no high-affinity hnRNP H-binding sites. These results indicate that FRET is strictly dependent on the binding of the tagged hnRNP H to its RNA target. Thus, RB-FRET can efficiently measure binding of the hnRNP H- and MS2-tagged proteins to their respective binding sites within the target RNA.
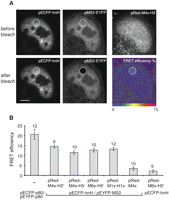
Detection of hnRNP H binding to its RNA binding site by FRET. (A) ECFP-tagged hnRNP H (ECFP-hnH) and EYFP-tagged MS2 (MS2-EYFP) proteins were coexpressed with HcRed1 containing MS2 and hnRNP H binding sites within its 3′ UTR. Each protein tag was imaged and visualized as indicated in each panel. EYFP was photobleached in a specific region (circled), and FRET efficiency was measured as an increase of ECFP fluorescence after EYFP photodestruction. Bars, 5 μm. (B) Quantification of FRET between ECFP-hnRH and MS2-EYFP coexpressed with different RNA-binding targets. FRET between ECFP-p80 and EYFP-p80 served as a positive control and coexpression of target RNA containing only MS2 binding sites (pRed-M4x) as a negative control. Cells expressing RNA with both target sequences (pRed-M6x-H5′) and ECFP-hnH only were analyzed as an additional negative control. The average and SEM are shown, and the number of assayed cells is indicated above the bars.
Next, we confirmed the FRET measurements obtained via acceptor photobleaching utilizing fluorescence lifetime imaging microscopy (FLIM). The FLIM-FRET approach is robust, quantitative, and less sensitive to artifacts with respect to concentration of fluorophores. FLIM estimates FRET efficiency by measuring the donor fluorescence lifetime, which shortens in the presence of an acceptor fluorophore. Thus, the more FRET, the greater reduction in the donor lifetime. Coexpression of the pECFP-p80/pEYFP-p80 pair positive control (Fig. 5A,C) showed a strong decrease in lifetime of the donor with respect to the expression of pECFP-p80 alone (Fig. 5A,C; Table 1). Similarly, in the RB-FRET assay expression of pRed-M4x-H3′ (2.88 ns), pRed-M4x-H5′ (2.75 ns), or pRed-M6x-H5′ (2.65 ns) caused a decrease in fluorescence lifetime of the donor ECFP-hnH with respect to the expression of the control substrate pRed-M4x (2.98 ns) (Fig. 5B,C; Table 1). Alternatively, the fluorescent protein Cerulean was used as a donor (Rizzo et al. 2004) and FRET was measured by FLIM as previously. Similar results were obtained for CFP/YFP and Cerulean/YFP FRET pairs (Figs. 5C, 6B; Table 1). In addition, a similar lifetime decrease was observed when the pRed-M1x-H1x substrate with only one of each binding sites was used (Fig. 6B; Table 1). These data confirmed the results obtained using the acceptor-photobleaching method, thus validating this novel approach for the analysis of RNA–protein interactions in situ.
Summary of the fit parameters from the biexponential fits of lifetime histograms using Cerulean and ECFP as FRET donors
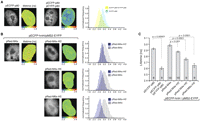
Binding of ECFP-hnH to its RNA binding site by FRET-FLIM in situ. (A) Lifetime of ECFP fluorescence was measured for ECFP-p80 as a negative control and ECFP-p80 coexpressed with EYFP-p80 as a positive control. Lifetimes within cells are shown in false colors: (blue) short lifetime; (red) long lifetime. Notice shortening of ECFP fluorescence lifetime, which is indicative of FRET. (B) ECFP-hnH and MS2-EYFP were coexpressed with constructs containing different binding sites, and the ECFP fluorescence lifetime was measured for each construct. pRed-M4x served as a negative control. ECFP fluorescence, lifetime heat-maps, and histograms of lifetime distributions are shown. (C) Quantification of lifetimes shown in A and B. Decrease of lifetimes indicates FRET between ECFP and EYFP constructs. In all cases, mean lifetimes of the biexponential fit are shown. The average and SEM are shown (SDs are indicated in Table 1), and the number of assayed cells is indicated within the bars.
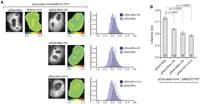
Quantification of lifetimes using Cerulean instead of ECFP as a FRET donor. (A) Cerulean-hnH and MS2-EYFP were coexpressed with constructs containing different binding sites, and Cerulean fluorescence lifetime was measured for each construct. pRed-M4x served as a negative control. Cerulean fluorescence, lifetime heat-maps, and histograms of lifetime distributions are shown. (B) Quantification of lifetimes shown in A. Decrease of lifetimes indicates FRET between Cerulean and EYFP constructs. The average and SEM are shown (SDs are indicated in Table 1), and the number of assayed cells is indicated within the bars.
DISCUSSION
The post-transcriptional processing and regulation of RNAs are key mechanisms in the control of gene expression. So far biochemical studies have not elucidated the complex set of interactions that govern the association of RNA and proteins and could not provide spatial and temporal information about where and when they occur within the cellular environment. Furthermore, recent work uncovered the multifaceted nature of the different mechanisms regulating the processing and the expression of cellular mRNAs, suggesting that such events are intimately coupled and need to be studied within a functional cellular environment to be fully understood.
The RB-FRET method described here enables the detection and localization of RNA–protein interactions within cells and is specifically useful for studying RNA-binding proteins with known RNA target sequence. As the RNAs and proteins studied can be expressed within a living cell, both the physical and biological properties of these complexes can be faithfully investigated. Furthermore, the tagged RNA-binding protein studied is expressed at physiological relevant levels. Indeed, endogenous and tagged hnRNP H are expressed in comparable amounts (Fig. 3B), indicating that this technique allows for the detection of interactions when components are expressed at physiologically relevant levels. The ability to study RNA–protein interactions inside cells enables the identification of those interactions that are likely to be biologically relevant from those that are not, a limitation of in vitro assays. In this case, although hnRNP H binding to the high-affinity binding site (GGGGA) had been reported in vitro (Schaub et al. 2007), it is unclear if this interaction happens in vivo, since the mutation of only a few of the numerous hnRNP H binding sites predicted within a given pre-mRNA appears to affect its splicing.
Trimolecular fluorescence complementation (TriFC) has been recently utilized to detect RNA–protein interaction in live cells (Rackham and Brown 2004). In this approach, the MS2 coat protein and the protein of interest are fused to two complementary portions of the Venus fluorescent protein. Binding of the two fusion proteins to a substrate RNA containing the RNA sequence of interest and the MS2-binding site allows for the two portions of Venus to come into close proximity and generate a fluorescent complex. Although this method is able to detect RNA–protein interactions in situ, its major pitfall is the permanent cross-link between the studied RNA-binding protein, MS2–protein, and likely the target RNA. In addition, the maturation of BiFC protein after formation of the protein–protein complex takes a considerable amount of time (Hu et al. 2002). Therefore, temporal and spatial regulation in response to physiological events cannot be observed with this method. Our technique overcomes these limitations since FRET is generated by close proximity between the donor and acceptor molecule and no stable complex is formed; furthermore, there is no lag time for the formation of the interaction. This allows for the characterization of interactions over time and in response to intracellular signals.
Utilizing YFP-tagged RNA-binding proteins and SytoxOrange-stained cellular RNA, Lorenz has recently utilized FRET-FLIM to detect the dynamic, temporal, spatial regulation of the binding of the RNA-binding protein of interest to cellular RNA (Lorenz 2009). Since SytoxOrange labels the RNA within the cell indiscriminately, this technique cannot determine if the RNA-binding protein studied is able to associate with the RNA sequence of interest. On the contrary, our methodology generates FRET only if the protein studied interacts with a specific substrate RNA. In summary, RB-FRET can determine RNA–protein interactions in living cells with high temporal and spatial resolution, allowing for the detection of the specific interaction between a known RNA-binding protein and an RNA sequence of interest.
MATERIALS AND METHODS
Plasmids construction
Construct pECFP-hnH was obtained by cloning the hnRNP H–coding sequence downstream from the ECFP coding sequence in the vector pECFP-C3 (Clontech) or pCerulean (Addgene). The construct pMS2-EYFP was obtained by cloning the coding sequence for the MS2 coat protein upstream of the EYFP gene in the pEYFP-N1 vector (Clontech). pRed-M1x and pRed-M4x were obtained by inserting either one or four MS2 coat protein-binding sites (AAACAAGAGGATTACCCTTGT) into the 3′ UTR of the vector pHc-Red-C1 (Clontech). pRed-M6x was obtained by inserting six MS2 coat protein-binding sites derived from the construct pSL-MS2-6X donated by R.H. Singer (Albert Einstein College of Medicine). Vectors pRed-M4x-H5′, pRed-M4X-H3′, and pRed-M6x-H5′ were obtained by inserting the double hnRNP H-binding site GGGGAGGGGA 50 nt upstream of (pRed-M4x-H5′, pRed-M6x-H5′) or downstream from (pRed-M4x-H3′) the MS2-binding sites. Vector pRed-M1x-H1x was obtained by inserting the single hnRNP H–binding site GGGGA 10 nt upstream of the MS2-binding site in pRed-M1x.
Cells and transfections
HeLa cells were cultured in Dulbecco's modified Eagle's medium supplemented with 10% fetal calf serum, penicillin, and streptomycin (GIBCO BRL). Cells were transfected with fluorescent protein-tagged constructs with Fugene HD (Roche) according to the manufacturer's protocol. Cells were grown for 24–28 h and fixed in 4% paraformaldehyde/PIPES (Sigma) for 10 min at room temperature. After rinsing with Mg-PBS (PBS supplemented with 10 mM Mg2+) and water, cells were embedded in glycerol containing 2.5% 1,4-diazabicyclo[2.2.2]octane (DABCO; Sigma Aldrich) as an antifade reagent.
Western blot analysis
HeLa cells were transfected with the indicated plasmids and 24 h later lysed in NP-40 buffer (50 mM Tris-HCl at pH 7.4, 150 mM KCl, 10% glycerol, 1% NP-40, 2 mM EDTA, 1 mM PMSF). The cell extract was denatured, separated on a 10% polyacrylamide gel, and blotted to nitrocellulose membrane. hnRNP H was detected with a polyclonal antibody donated by D. Black (University of California at Los Angeles). MS2 coat protein was stained with a polyclonal antibody donated by Peter G. Stockley (University of Leeds). GFP variants were detected with the monoclonal antibody B-2 (SC-9996; Santa Cruz Biotech). The bands were visualized by chemiluminiscence of the peroxidase activity of a peroxidase-conjugated secondary antibody by using ECL.
RNA-affinity chromatography (RAC) assays
Substrate RNAs for RAC were generated by PCR amplification of the sequences contained within the corresponding pRed 3′-UTR. The 5′ primer utilized for the amplification contained the minimal T7 promoter sequence. RNAs were synthesized utilizing T7 RNA polymerase. RNAs were covalently linked to adipic acid dihydrazide agarose beads as previously described (Caputi et al. 1999). The beads containing immobilized RNA were incubated in a reaction mixture containing HeLa extracts dialyzed in a final volume of 400 μL (20 mM HEPES-KOH at pH 7.9, 5% glycerol, 0.1 M KCl, 0.2 mM EDTA, 0.5 mM DTT, 4 mM ATP, 4 mM MgCl2) for 1 h at 30°C. HeLa extracts were obtained upon lysis of 4 × 10⁵ cells transfected with the indicated plasmids. Beads were then washed, and the proteins were specifically bound to the immobilized RNA eluted in 2% SDS, separated on polyacrylamide SDS gels, electroblotted, and probed with the indicated antibody.
Fluorescence resonance energy transfer
FRET was measured by the acceptor photobleaching method. FRET measurement was performed on the Leica TCS SP5 confocal microscope using the FRET acceptor photobleaching protocol (Leica). The HCX PL APO 63×/1,40-0,6 oil, Lbd Blue CS objective, 50-mW diode laser (405 nm) and 100-mW Ar laser were used. The data acquisition was performed in 512 × 512 format with 400 Hz scan speed and 1,6 Airy pinhole in 16-bit resolution. The gain of the photomultiplier detectors was adjusted to obtain the optimal dynamic range. The 405-nm laser line with 5%–10% of maximum power was used for CFP detection in wavelength range 446–506 nm. The laser line at 514 nm was used for YFP detection with 2% of laser intensity and YFP photobleaching with 30% of laser intensity in three to five consecutive scans. The detected wavelength range for YFP was 526–568 nm. Minimal CFP bleaching (0%–2%) was observed and was not taken into account for the calculation of FRET efficiency. The CFP fluorescence was measured before (CFPbefore) and after (CFPafter) the YFP bleaching using Leica software (FRET Photobleaching Wizard), and apparent FRET efficiency directly without any background subtraction was calculated according to the equation FRETefficiency[%] = (CFPafter − CFPbefore) × 100/CFPafter. A region in the nucleoplasm was bleached, and FRET efficiency was calculated as an average of the whole area. Values for all cells were averaged, and the standard error of the mean was calculated. An unbleached region of the nucleoplasm of the given cell was used as a negative control. The averages of unbleached regions were −10%–0% for each pair tested. The number of analyzed cells is given in graphs.
Fluorescence lifetime imaging microscopy
The FLIM was carried out according to Wahl et al. (2004) on a MicroTime 200 inverted epifluorescence scanning confocal microscope (Picoquant). The configuration contained a pulsed diode laser (LDH-P-C-440, 440 nm; Picoquant) providing 80-psec pulses at up to a 40-MHz repetition rate, a proper filter set (cleanup filter Z438/10, dichroic mirror z440rdc, and band-pass filter HQ480/40; Chroma), a water immersion objective (1.2 NA, 60×; Olympus), and two SPAD detectors (MPD) with a polarization beam splitter. The FWHM of the overall IRF was 300 psec. Data acquisition was performed in TTTR mode, an advanced mode of TCSPC. The data were acquired and analyzed in SymphoTime200 software (Picoquant). A pixel size was 100 × 100 nm, the time per pixel 1.2 msec, and the size of the image varied between 100 and 200 pixels per dimension depending on the imaged cell size. Under the used average intensity of 2 μW at the back aperture of the objective, each pixel of selected ROI contained between 500 and 1500 photons, fulfilling the TCSPC condition for maximum count rate (maximum 5% of laser repetition rate). The TCSPC histograms were a priori corrected for anisotropy effect by proper summing of signals from two SPADs with orthogonal polarizations. The average lifetime for selected ROI was determined by tail-fitting of the overall TCSPC histogram (∼107 photons). The FLIM images were prior analysis binned 2 × 2 and analyzed by a tail-fitting FLIM approach using two exponentials. The presented average lifetime is an intensity-weighted average of both contributions. The mean and standard deviation of the mean of the average lifetimes were determined. The number of assayed cells is given in graphs.
ACKNOWLEDGMENTS
We thank Dr. Mike Lu for helpful comments and Dr. Mike Lorenz for helpful suggestions regarding the FLIM approach. This work was supported by NIH/NIAID grant R01AI052820 to M.C., grants from the Max Planck Society (the Partner group program) and from the Academy of Sciences of the Czech Republic (KAN200520801, AV0Z50520514) to D.S., and a grant from the Ministry of Education of the Czech Republic (LC06063) to M.H.
Footnotes
-
Reprint requests to: Massimo Caputi, Department of Basic Science, Florida Atlantic University, Boca Raton, FL 33431, USA; e-mail: mcaputi{at}fau.edu; fax: (561) 297-2221.
-
Article published online ahead of print. Article and publication date are at http://www.rnajournal.org/cgi/doi/10.1261/rna.1678209.
-
- Received April 3, 2009.
- Accepted August 12, 2009.
- Copyright © 2009 RNA Society




