


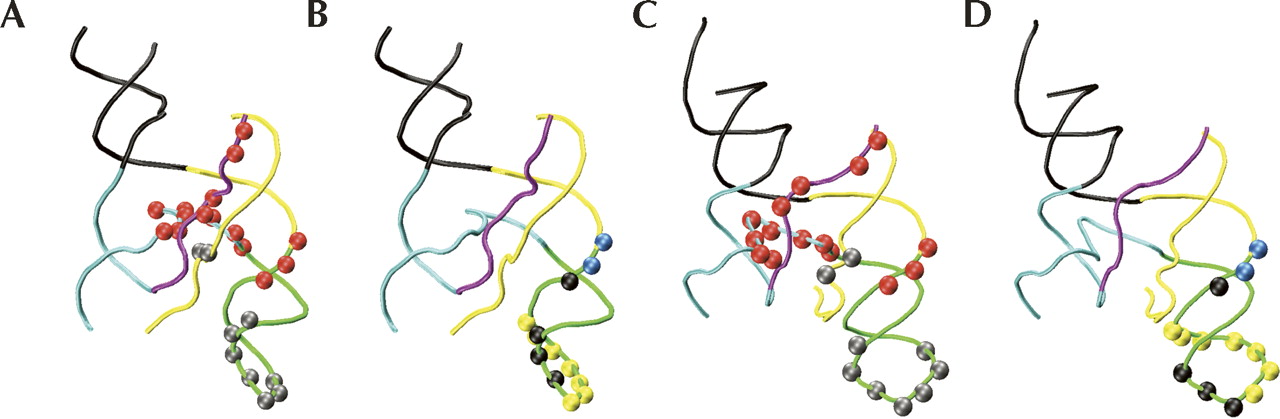
FIGURE 8.
Locations of AOP cleavage sites on PRNA sites of AOP cleavage are shown mapped onto a biochemical model of B. subtilis PRNA (Massire et al. 1998; (A,B) and X-ray crystal structure of B. sterothermophilus PRNA (Kazantsev et al. 2005; (C,D). Regions of secondary structure containing the majority of cleavage sites are shown: P1 (black), P2 and J2/3 and J18/2 (yellow), P3 (green), P4 and J3/4 (cyan), and J19/4 (violet). Cleavage sites from regions of P protein (Table 2) are marked with spheres: (A,C) RNR motif (red), metal binding loop (gray), (B,D) N terminus (yellow), β-strand 3 (blue), and both the N terminus and β-strand 3 (black).




