


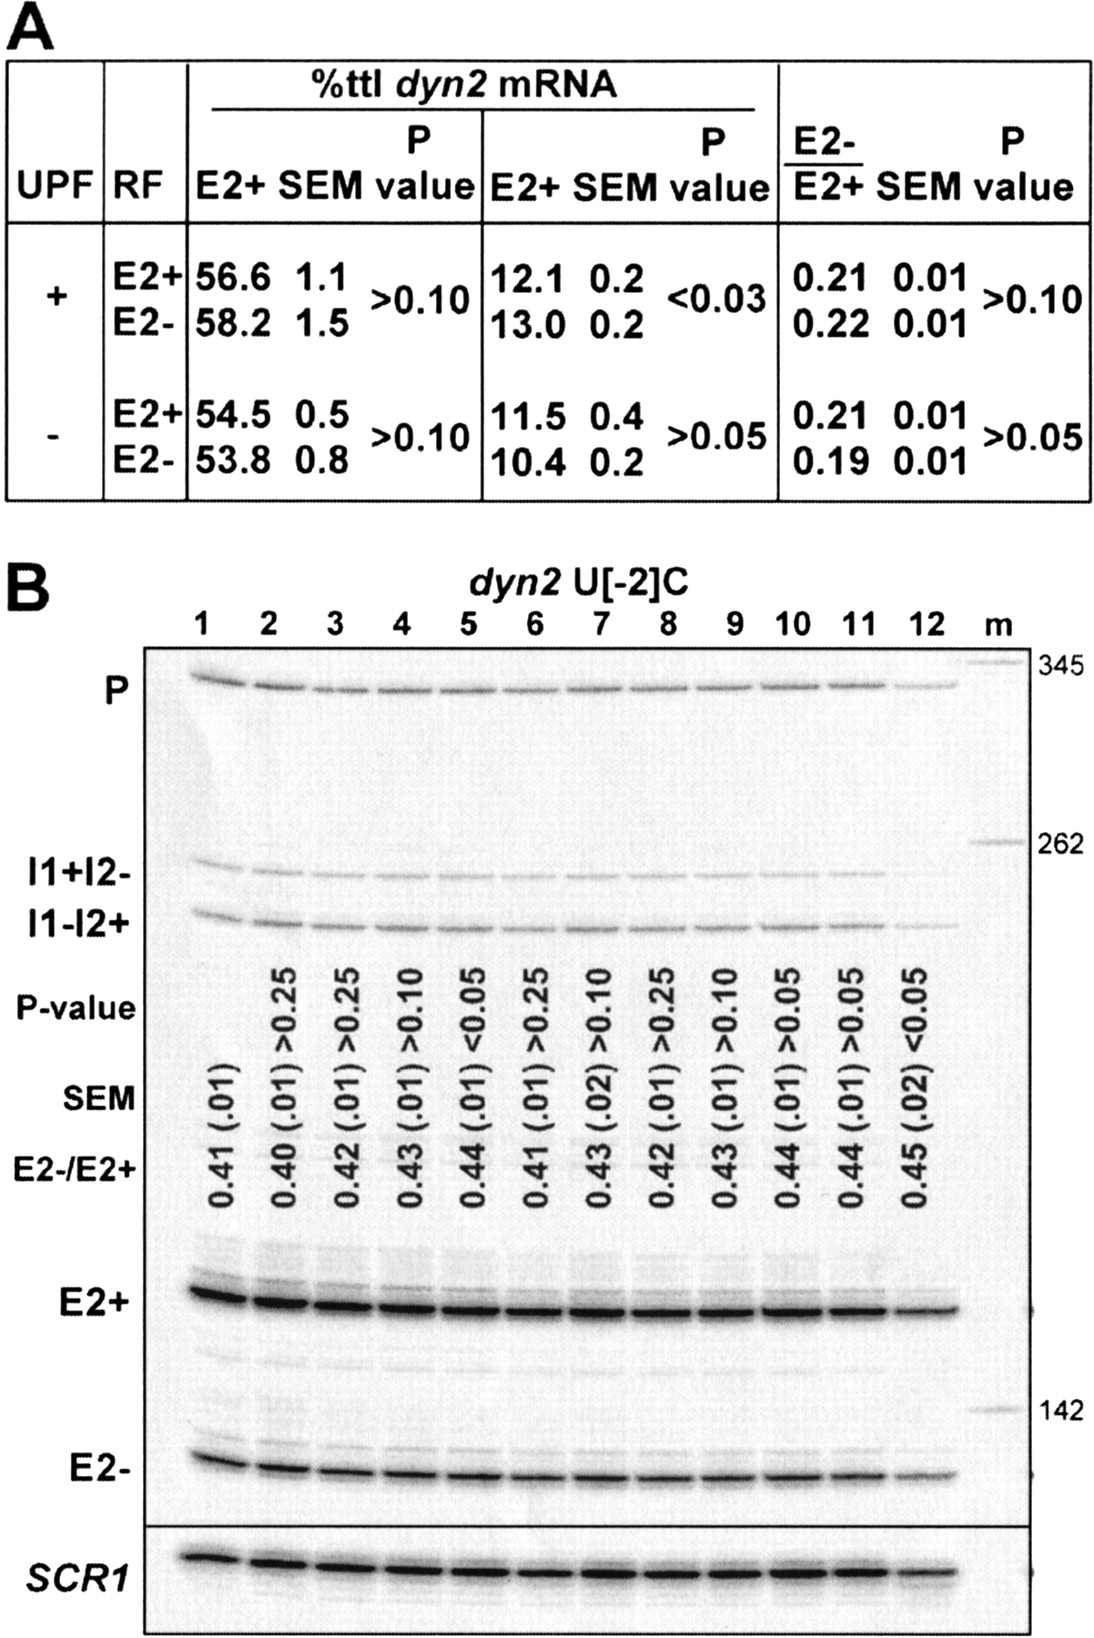
Differences in levels of exon skipped and included mRNAs are not caused by differences in their relative steady-state stabilities or decay rates. (A) Strains HFY114 (UPF1) and HFY870 (upf1Δ) (Table 1) carry dyn2-CUP1 plasmids pU[−1]A and pU[−1]A*, which are identical except that they possess translational opposite reading frames (RFs). E2+ and E2− levels (percentage of all dyn2 RNAs) and alternative splicing ratios (E2−/E2+) were calculated (±SEM, n = 3). Probability values (P) comparing E2+ or E2−, or E2−/E2+ from both reading frames were determined using Student’s t test. P values >0.05 signify the compared values are not significantly different. (B) 1,10-Phenanthroline treatment of strain KH51B4 expressing pU[−2]C. Because the drug blocks nascent transcription by all DNA-dependent RNA polymerases, absolute decay rates cannot be measured (equivalent amounts of SCR1 cDNA were loaded in each lane except lane 12). Rather, relative decay rates of the E2+ and E2− mRNAs were measured by taking the E2−/E2+ ±SEM ratio (n = 4). P values were determined by comparing E2−/E2+ values in each lane to lane 1. Time points for lanes 1–12, respectively, are (in minutes): 0, 3, 6, 10, 15, 20, 30, 40, 60, 90, 120, 180.




