


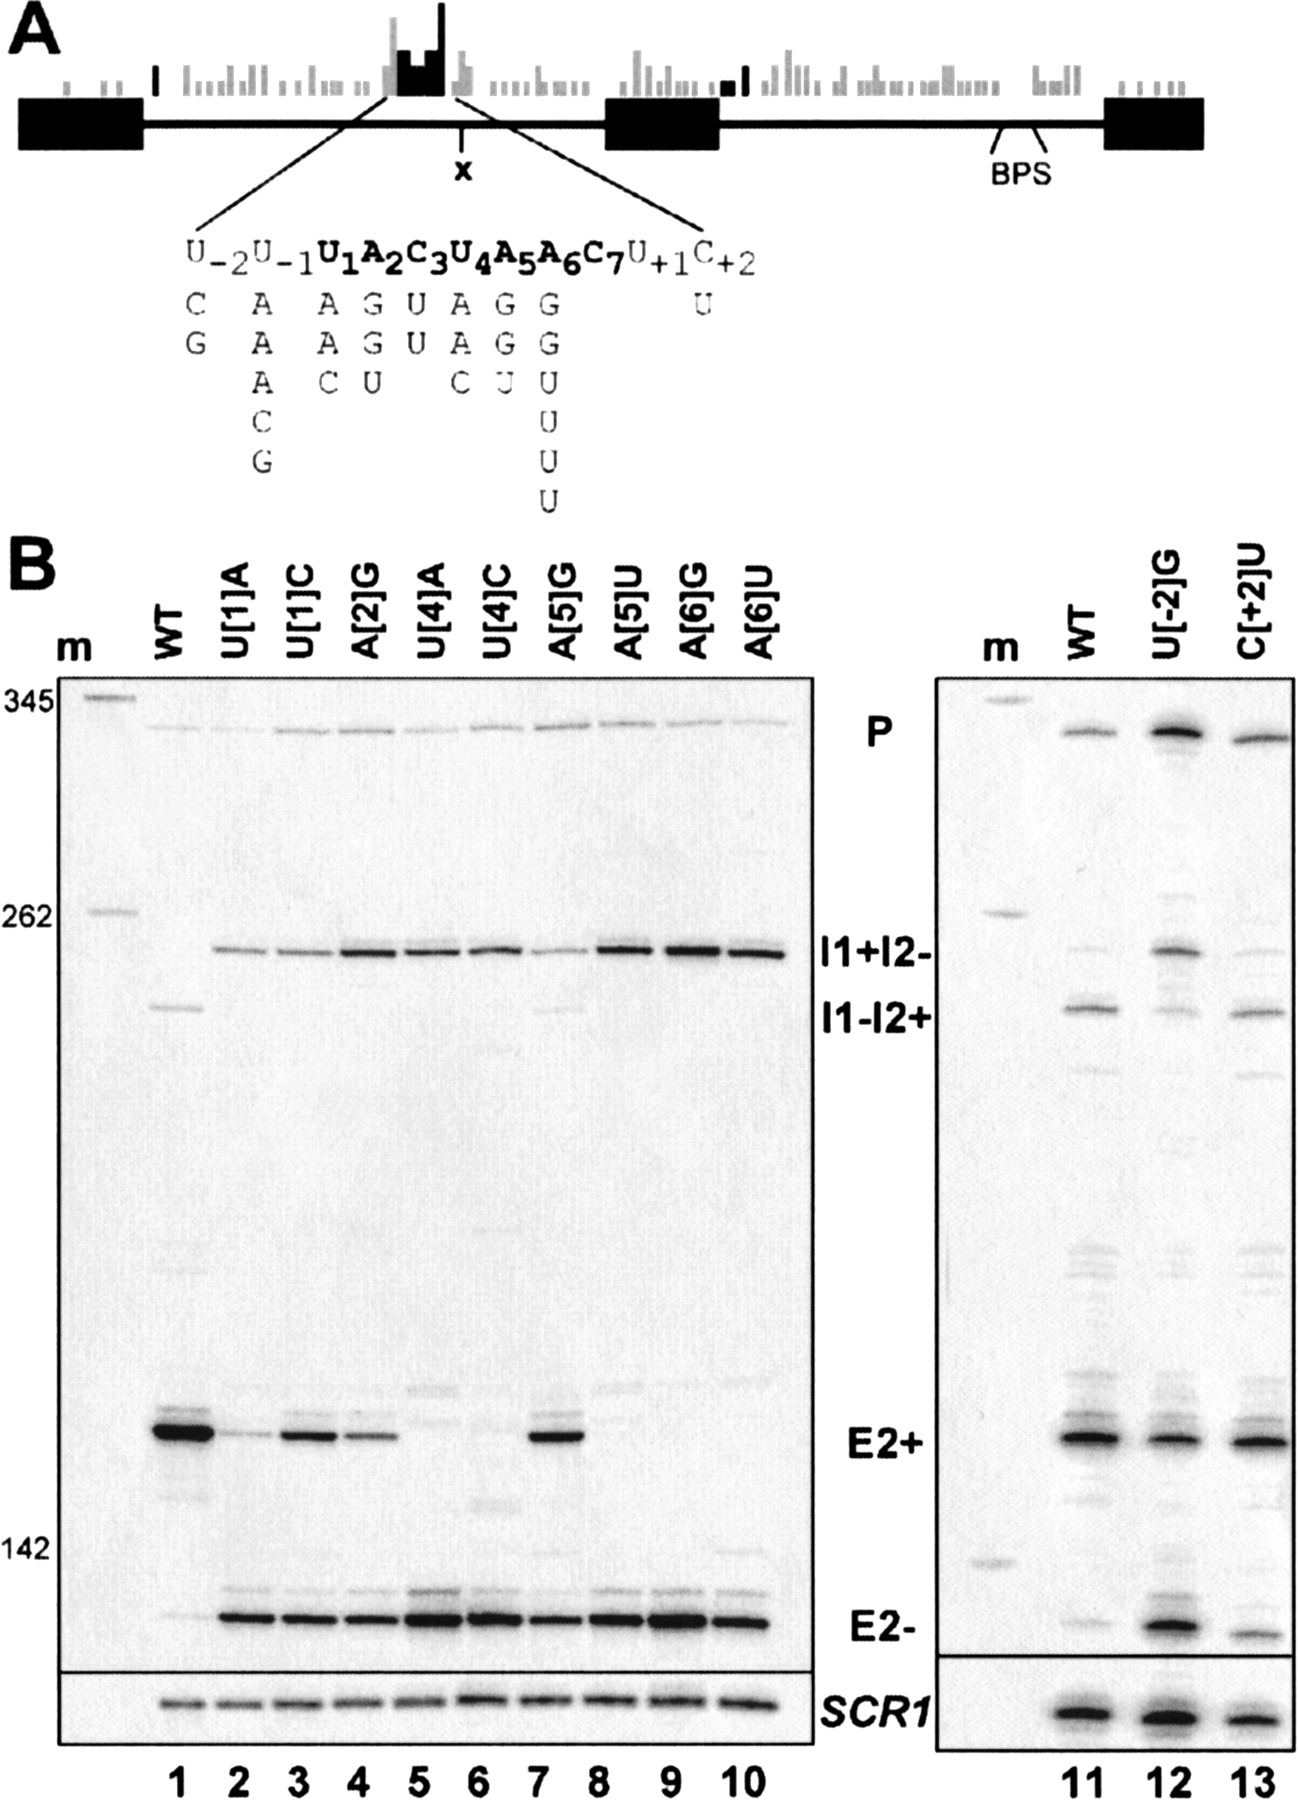
Cis-acting exon skipping mutations. (A) Schematic of positions altered by mutation. Each bar represents a base position changed within a unique mutant sequence, and the height of the bar indicates the frequency with which a change at that position was identified in the library (many of the sequences carried multiple mutations). Dark bars indicate mutations within the conserved splicing signals. Shown in detail is the branchpoint region in intron 1 (numbering relative to the conserved branchpoint sequence). Changes are indicated beneath the wild type sequence. X indicates XhoI site used for subcloning. (B) Primer extension analysis of exon skipping mutants. Single base mutants derived from the high CuR selection (left gel, lanes 2–10) and low/moderate CuR selection (right gel, lanes 12,13) are shown. Products were normalized to SCR1 cDNA and are labeled as described in Figure 1B.




