


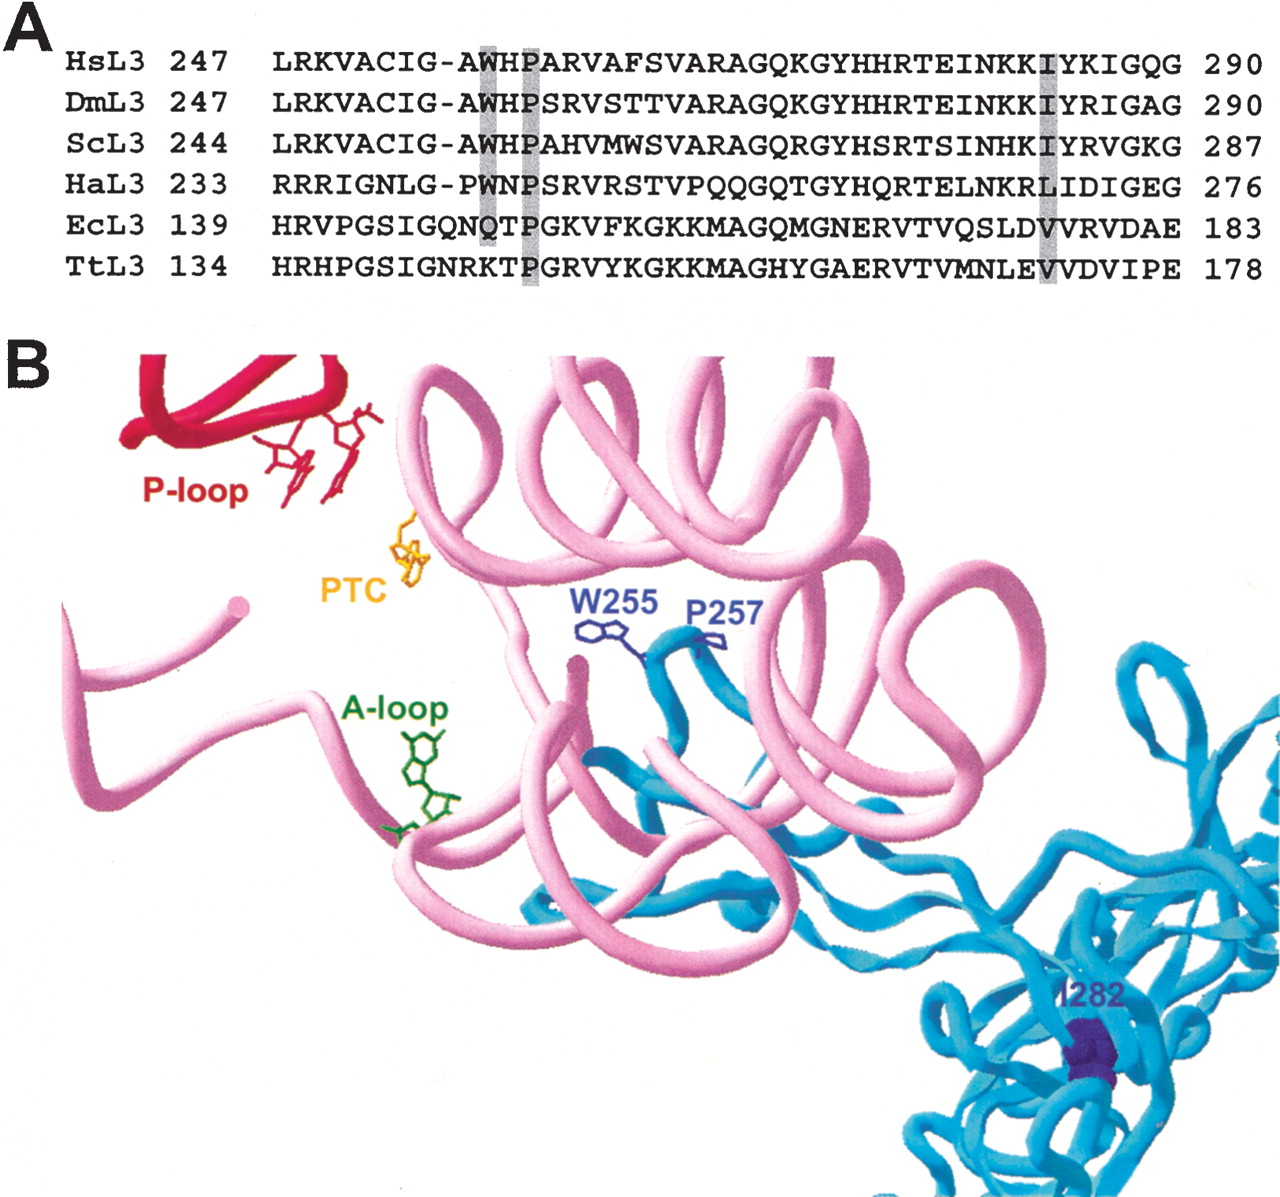
L3 and the peptidyltransferase center. (A) ClustalW alignment of selected regions of ribosomal protein L3. The rimary amino acid sequences from six representative species in the vicinity of the amino acids of L3 examined in this study were aligned. L3 sequences were from the following species: H. Sapiens (HsL3 from amino acids 247–290), D. melanogaster (DmL3, from amino acids 247–290), S. cerevisiae (ScL3 from residues 244–287), H. marismortui (HaL3 from residues 233–276), E. coli (EcL3 from residues 139–183), and T. thermophilus (TtL3 from amino acids 134–178). The three amino acids of interest to this study are highlighted. (B) Mapping of the L3 mutants within in the context of the H. marismortui 50S crystal structure at 2.4 Å. L3 is colored blue. W255 and P257 are shown in stick outline, while I282 is shown in space filling mode. Helix 80 (P-loop) is indicated in red, and helices 89–93 are in pink. The peptidyltransferase center active site (PTC) is shown in yellow (H. marismortui 2486; E. coli A2451). The base of the 23S rRNA of the A-loop that interacts with the 3′ end of the aa-tRNA is shown in green (H. marismoutui U2588; E. coli G2553), and those that interact with the 3′ end of the peptidyl-tRNA and P-site (H. marismortui G2284, G2285; E. coli G2252 and G2253) are in red.




