


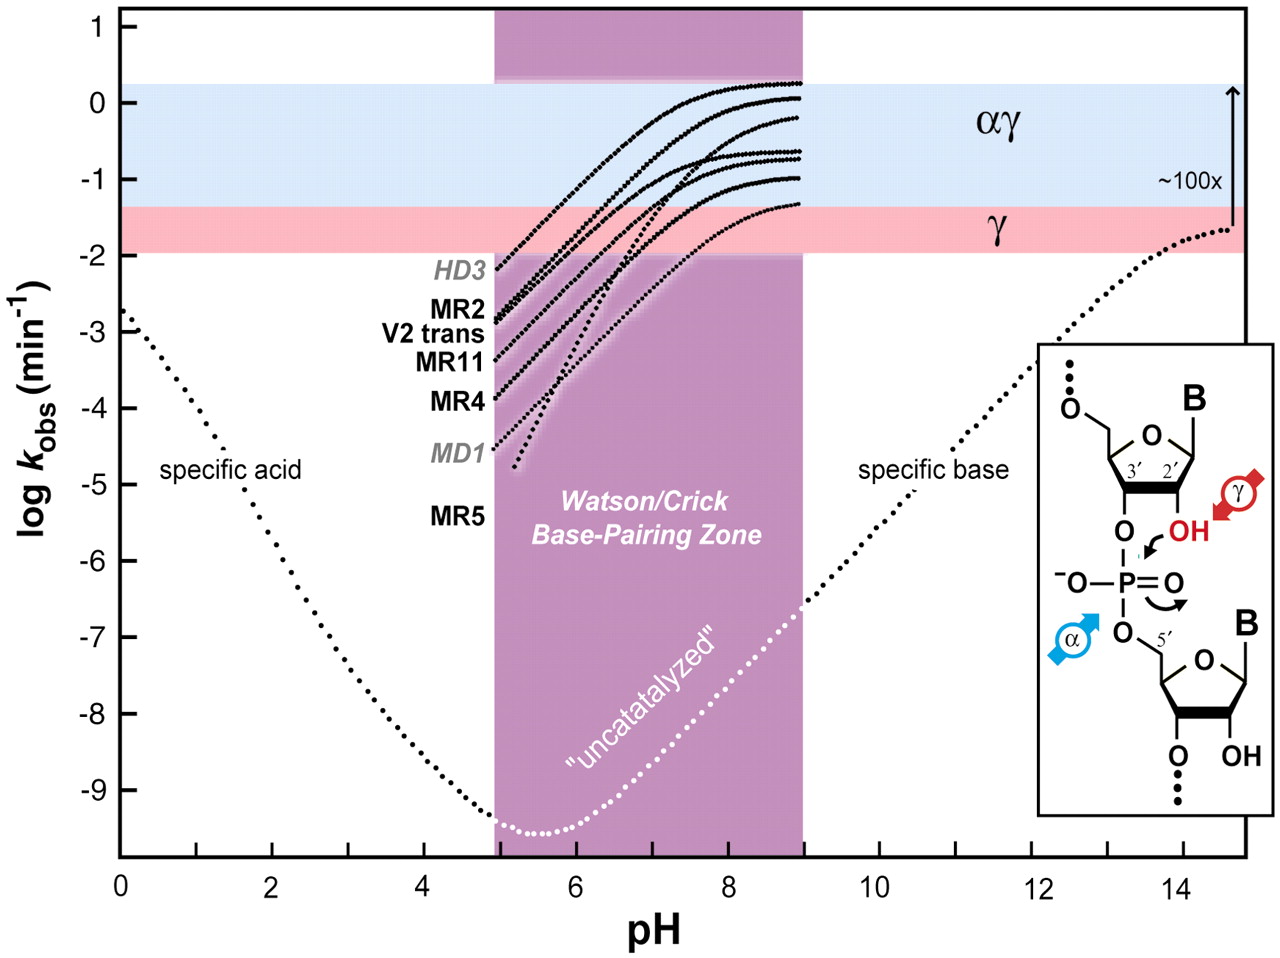
Engineered ribozymes that appear to maximize two catalytic strategies. The composite plot depicts the kinetic behavior of seven RNA-cleaving ribozymes (black text) and deoxyribozymes (gray, italics text) compared with the profile expected for the spontaneous cleavage of RNA (see Fig. 2A). The pH range from 5 to 9 (purple) is expected to permit Watson/Crick pairing without pH-induced disruption. The range for the maximum rate constants for γ catalysis (pink), and for the combination of α and γ catalysis (light blue) are indicated. The pH profiles for the enzymes were derived from (Breaker et al. 2003). The distinct slope of the MR5 ribozyme could be explained by a combination of αγ catalysis and the need for a second deprotonation event to satisfy a structural requirement. (Inset) The α and γ catalytic strategies that, when used in combination, can explain the maximum rate constants and the kinetic profiles of the enzymes depicted.




