


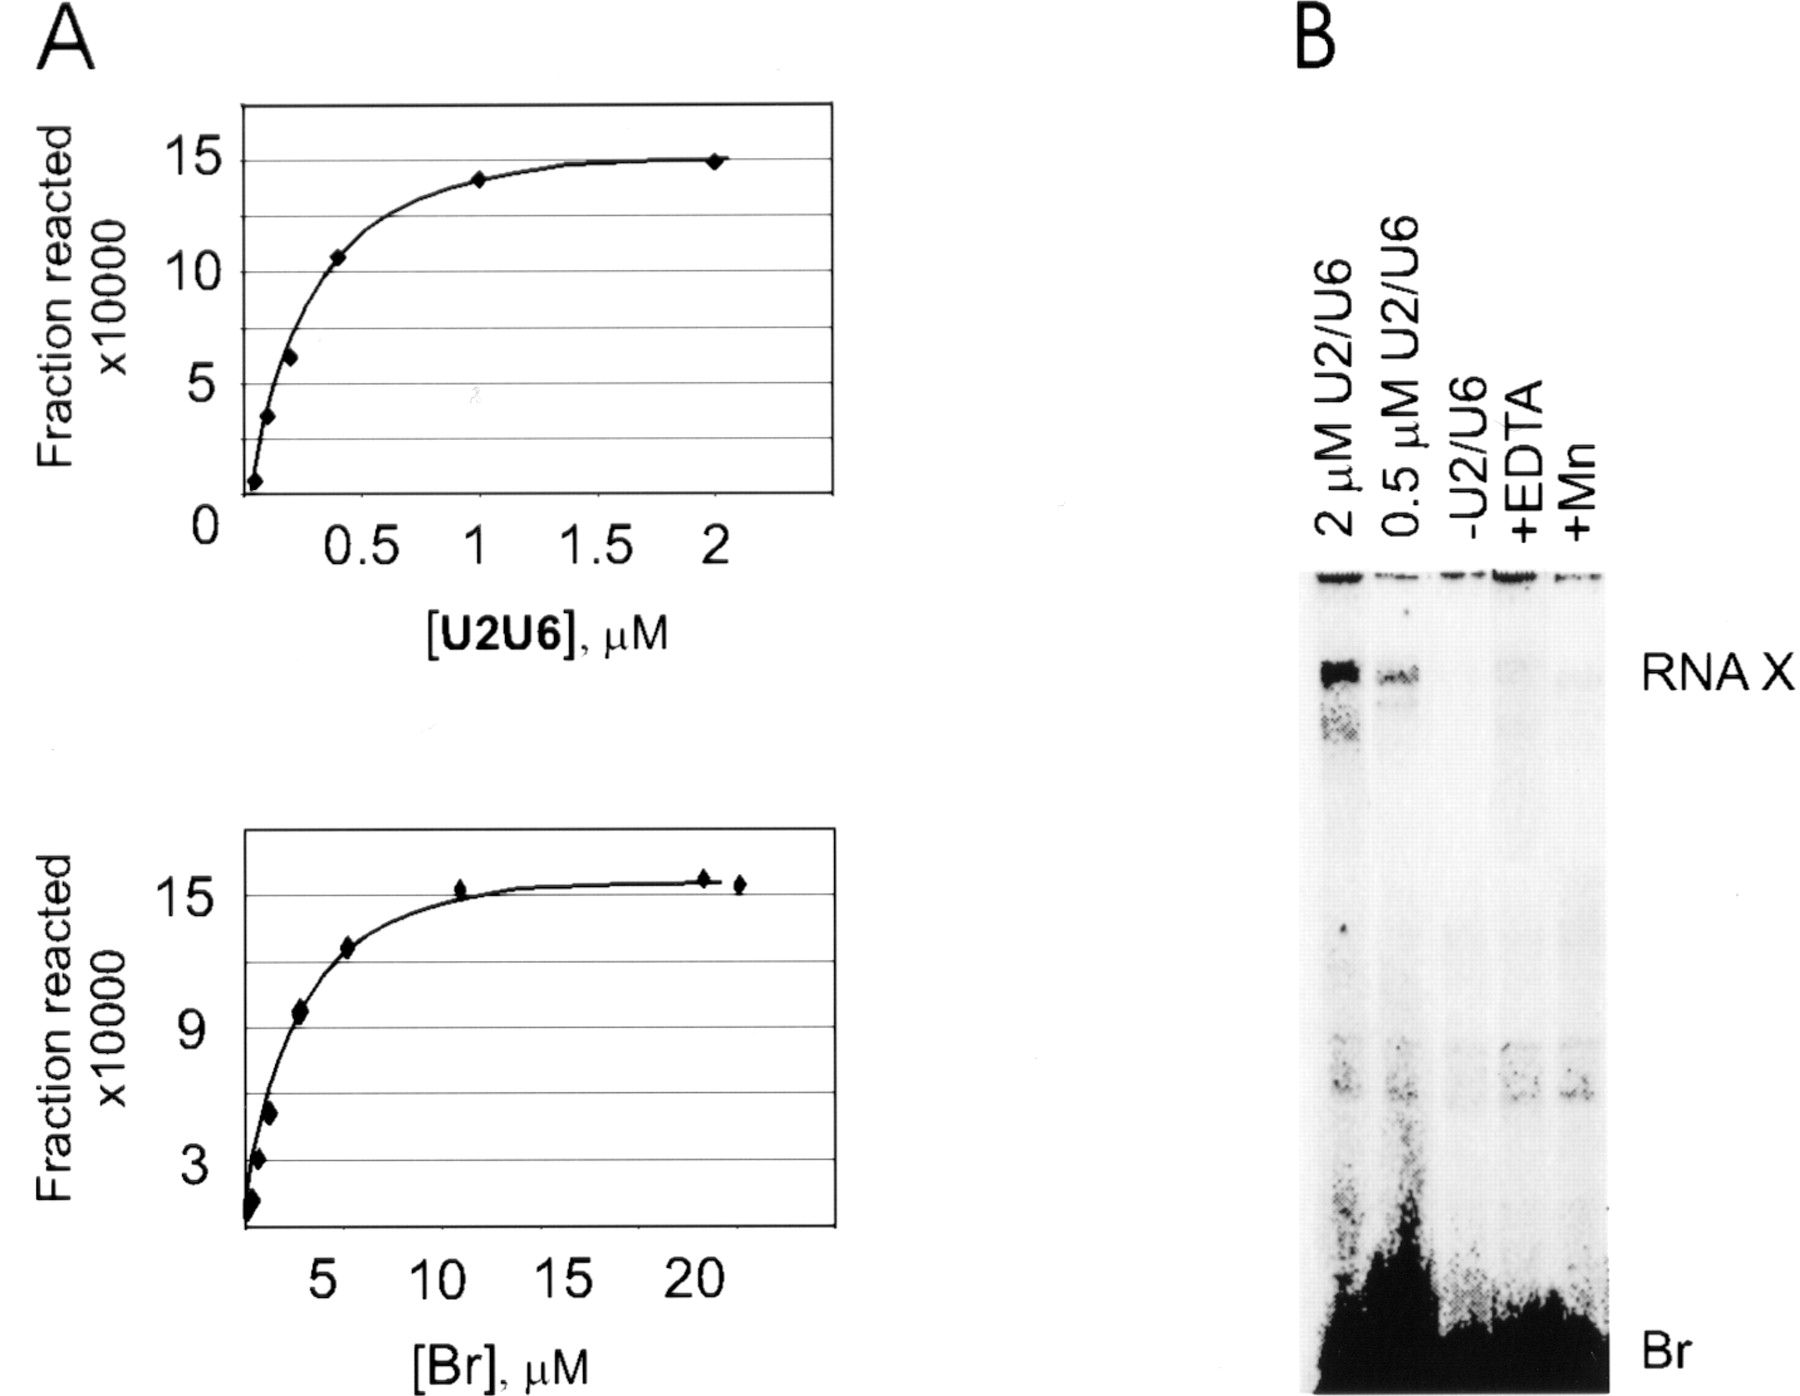
RNA X formation shows characteristics of an equilibrium reaction. (A) Response of RNA X formation to various concentrations of Br and U2/U6. The graphs plot the amount of RNA X formed in various concentrations of U2/U6 (top panel) or Br (bottom panel). (B) RNA X formation by a U2/U6 chimera. The concentration of the U2/U6 chimera is noted above each lane. The reaction analyzed in the lane marked −U2/U6 contained only Br and reaction buffer. The reaction in lane marked +Mn contained Mn++ instead of Mg++, whereas that in the lane marked +EDTA had received 50 mM EDTA after the addition of reaction buffer (see Materials and Methods). The location of RNA X and Br are shown to the right.




