


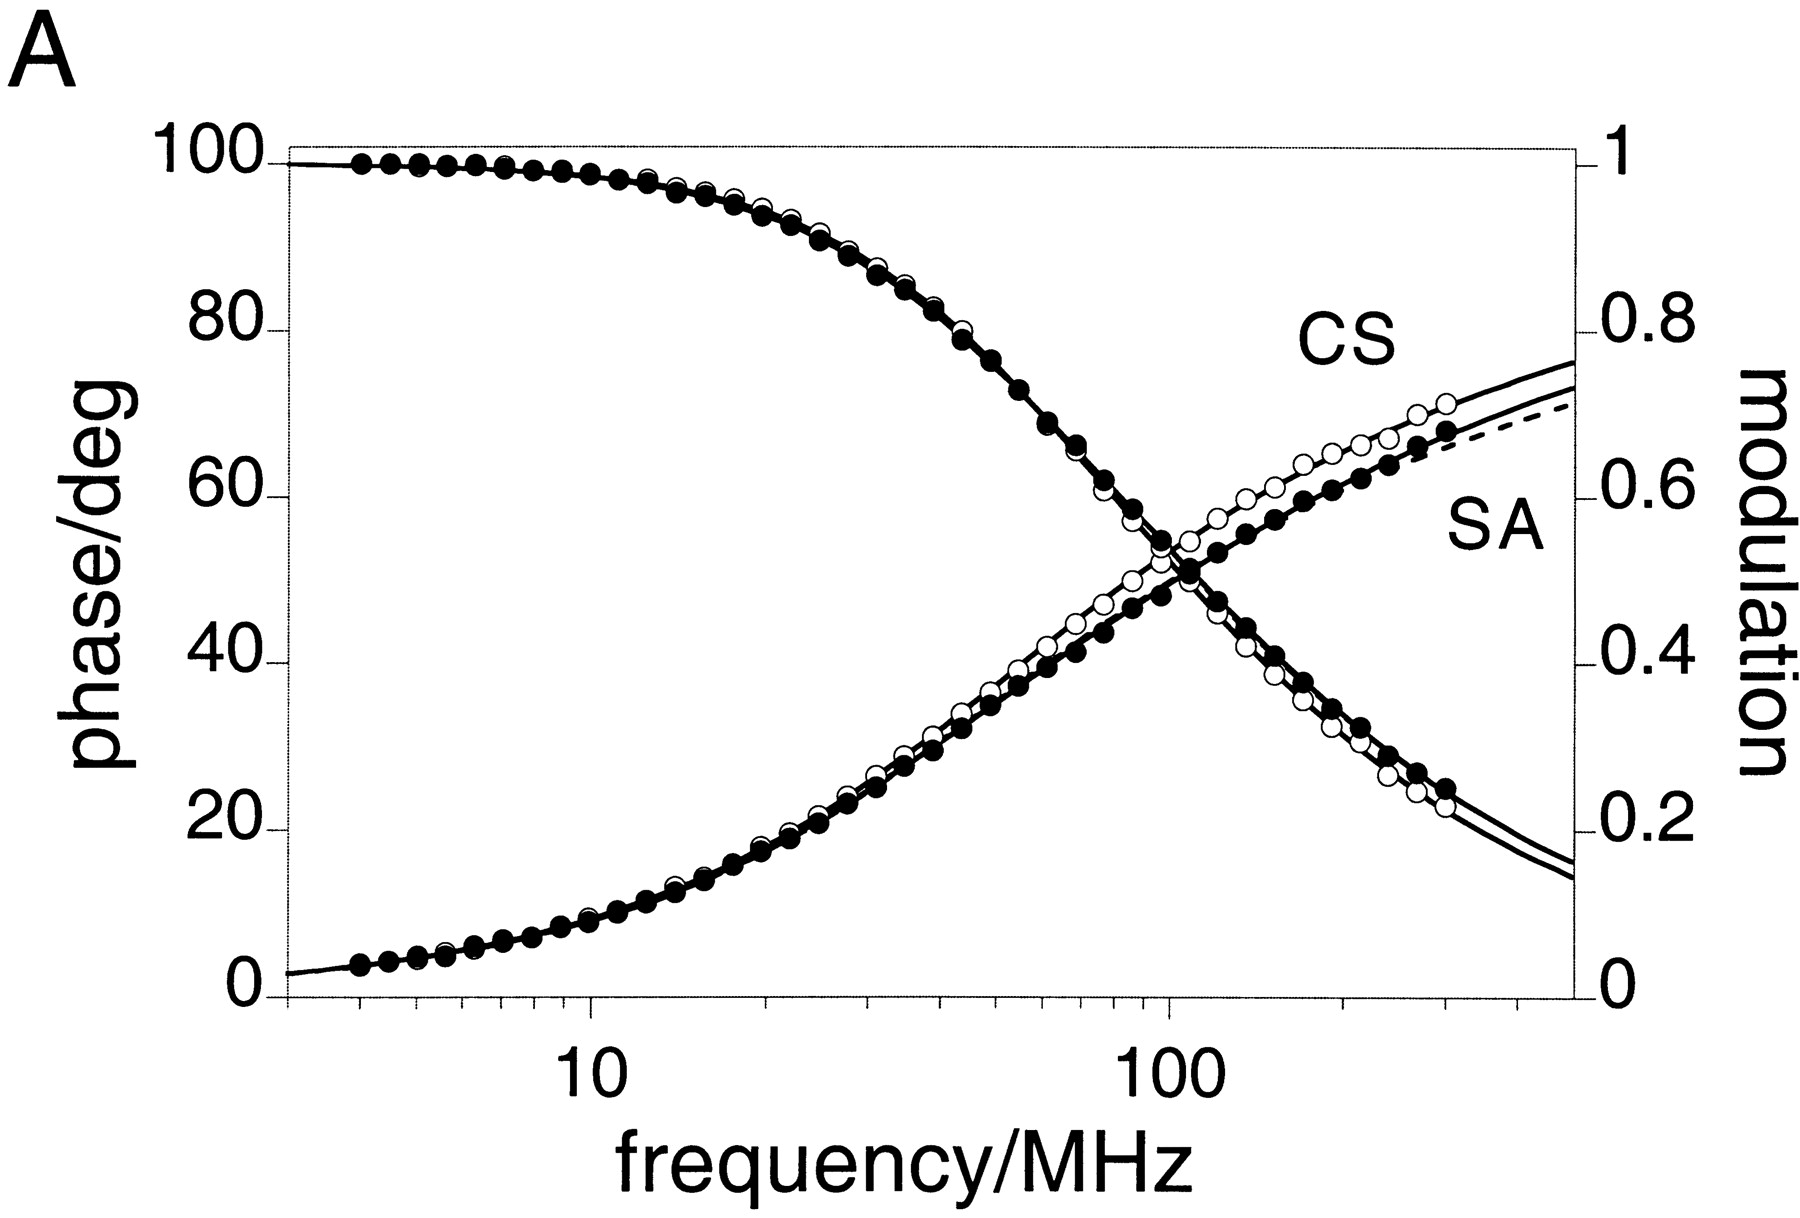
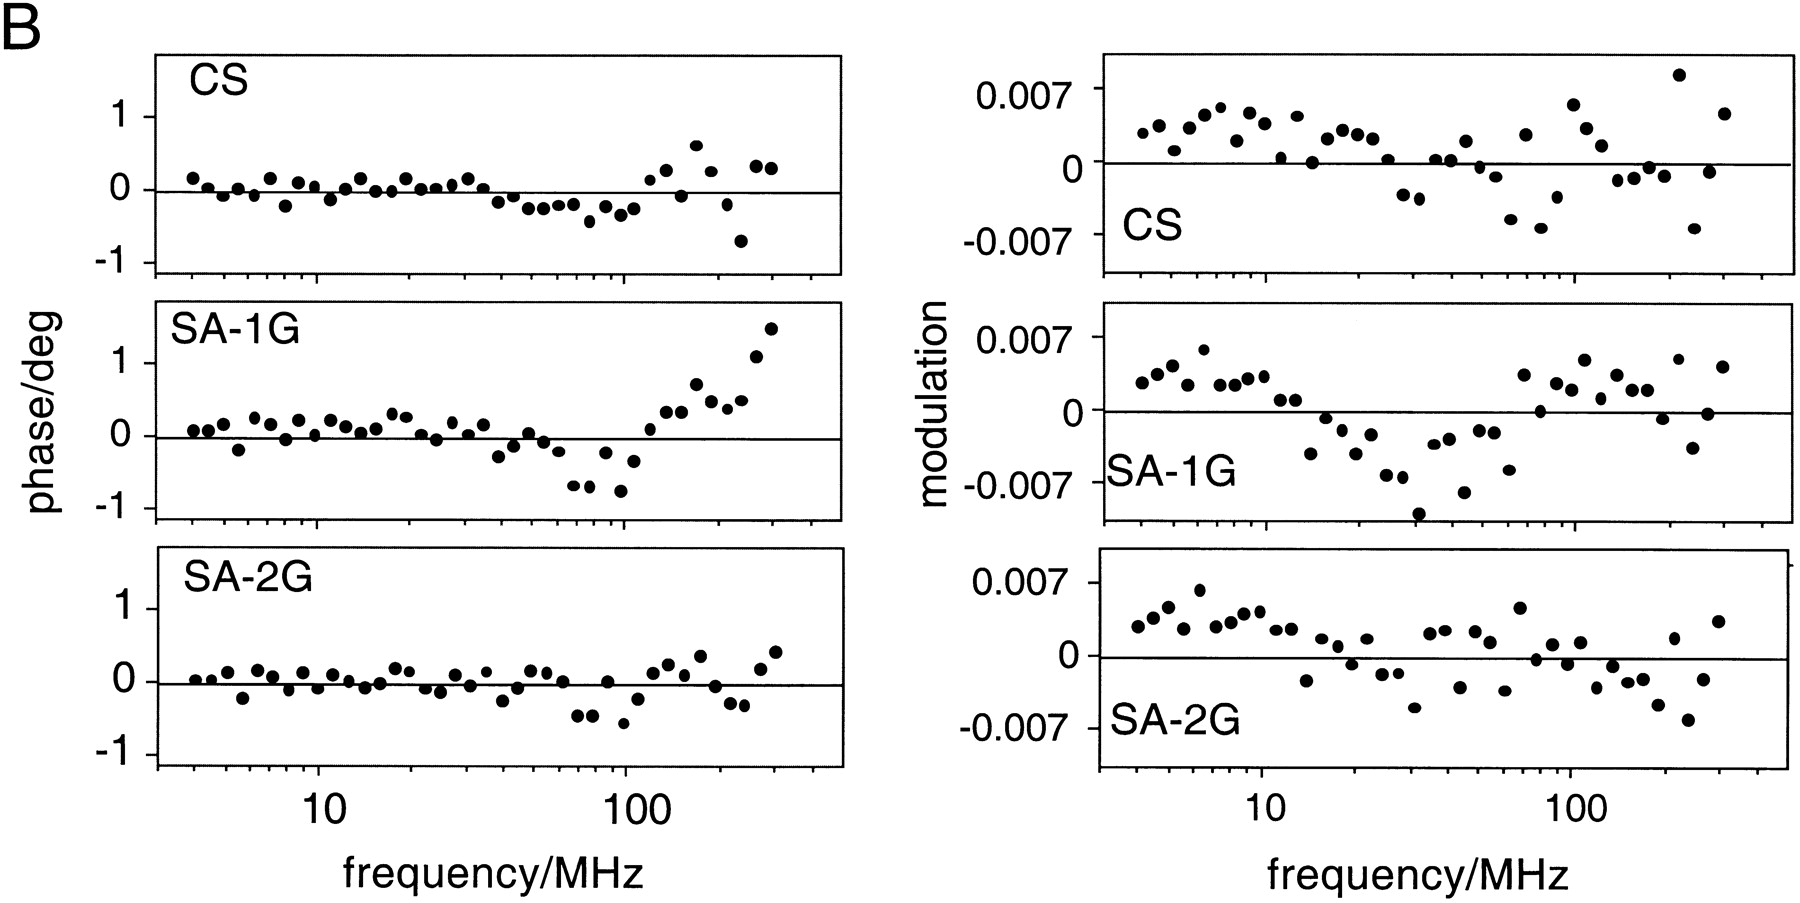
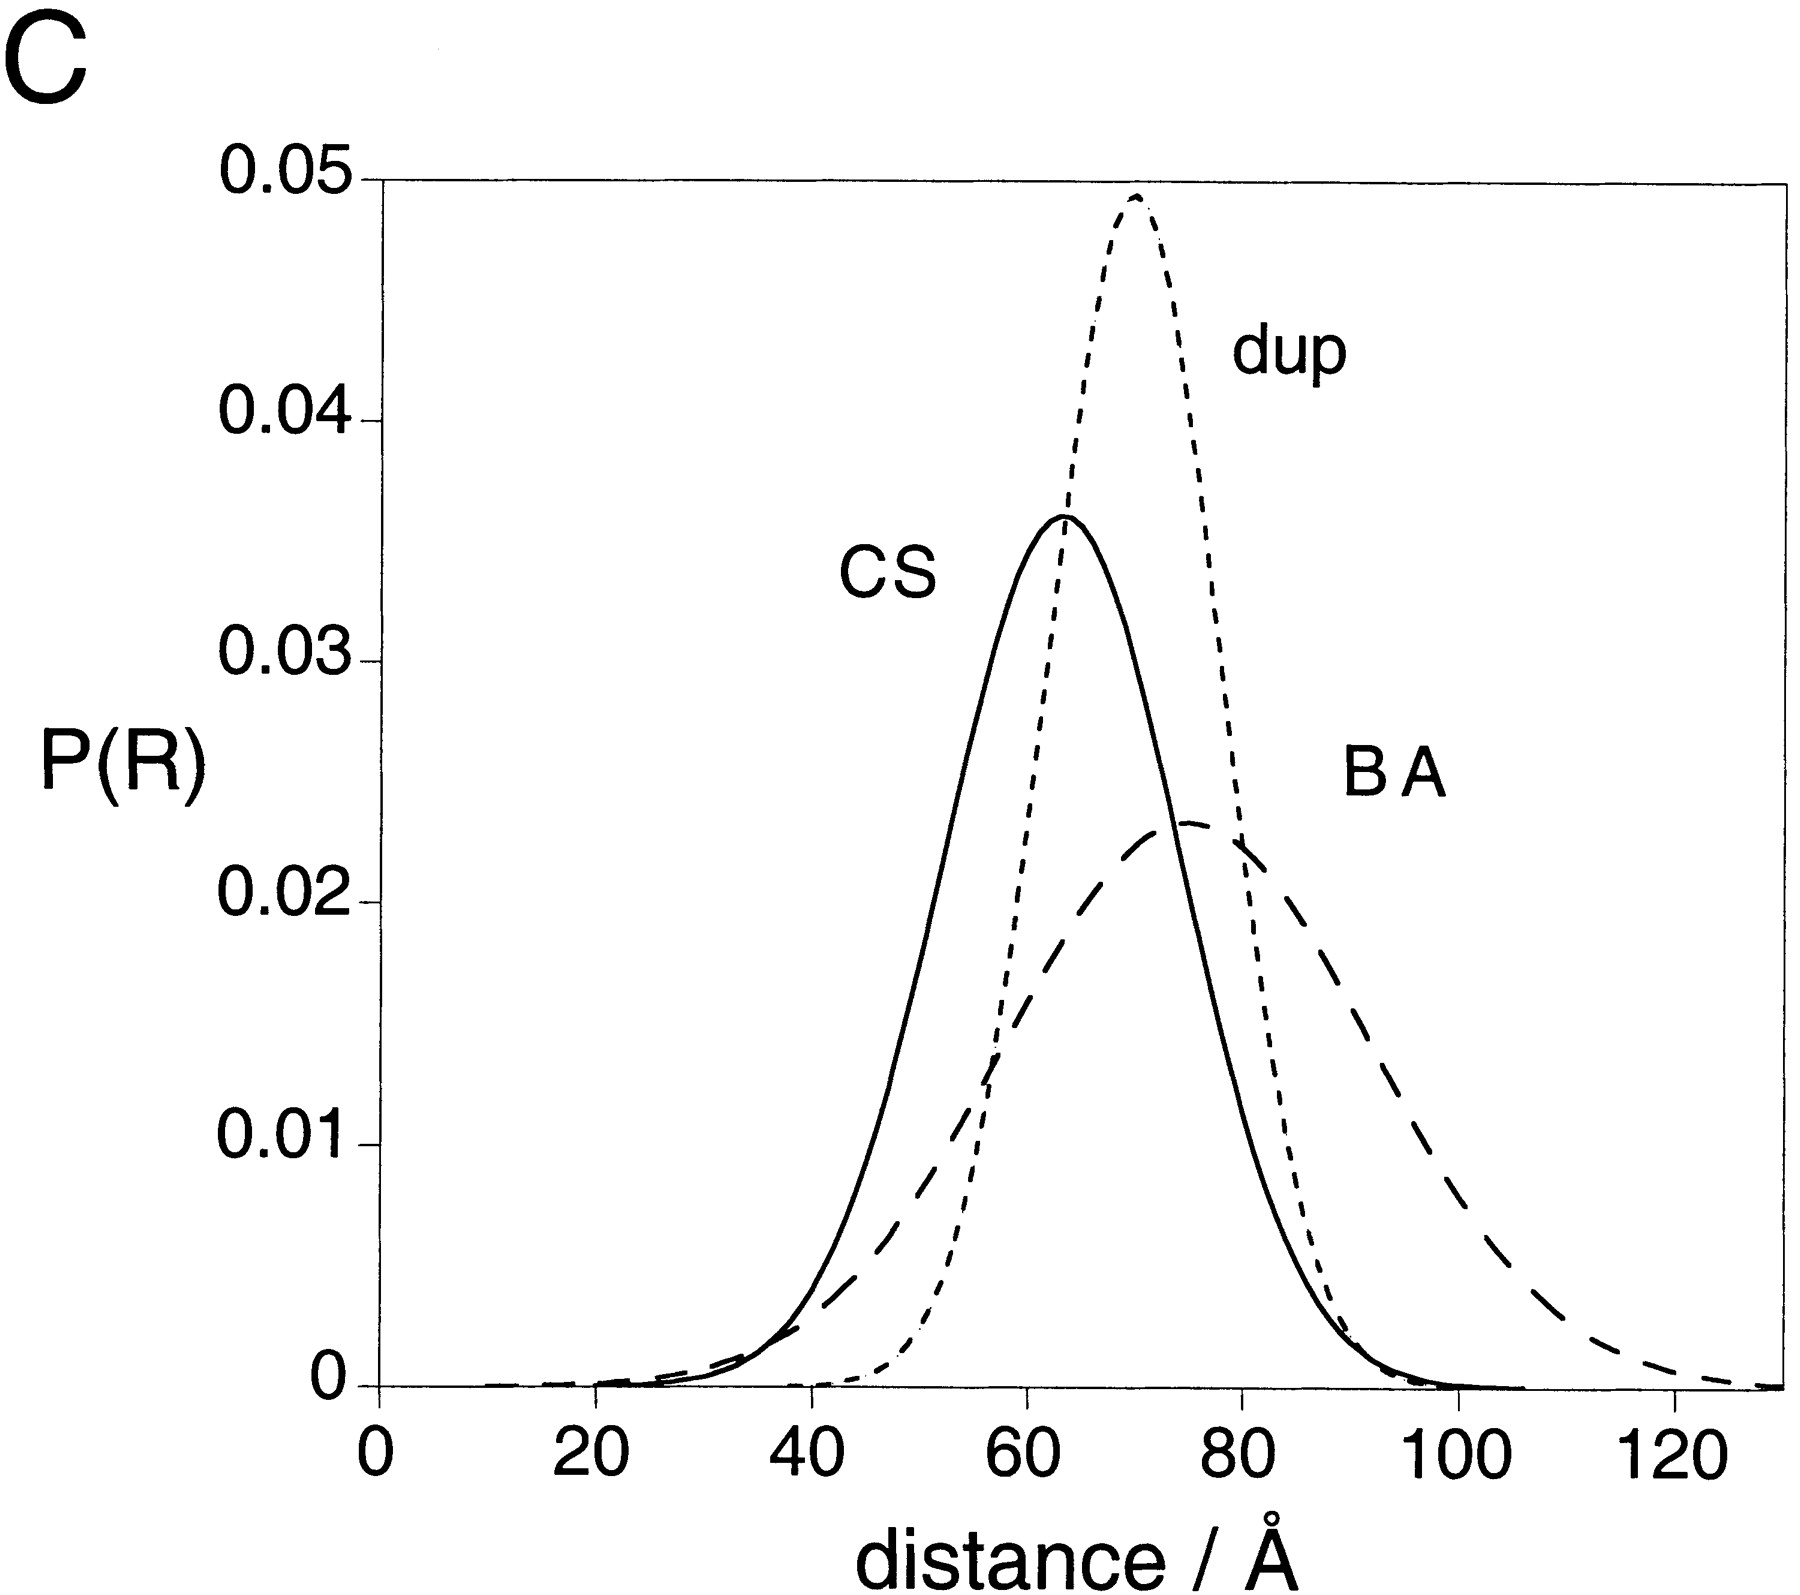
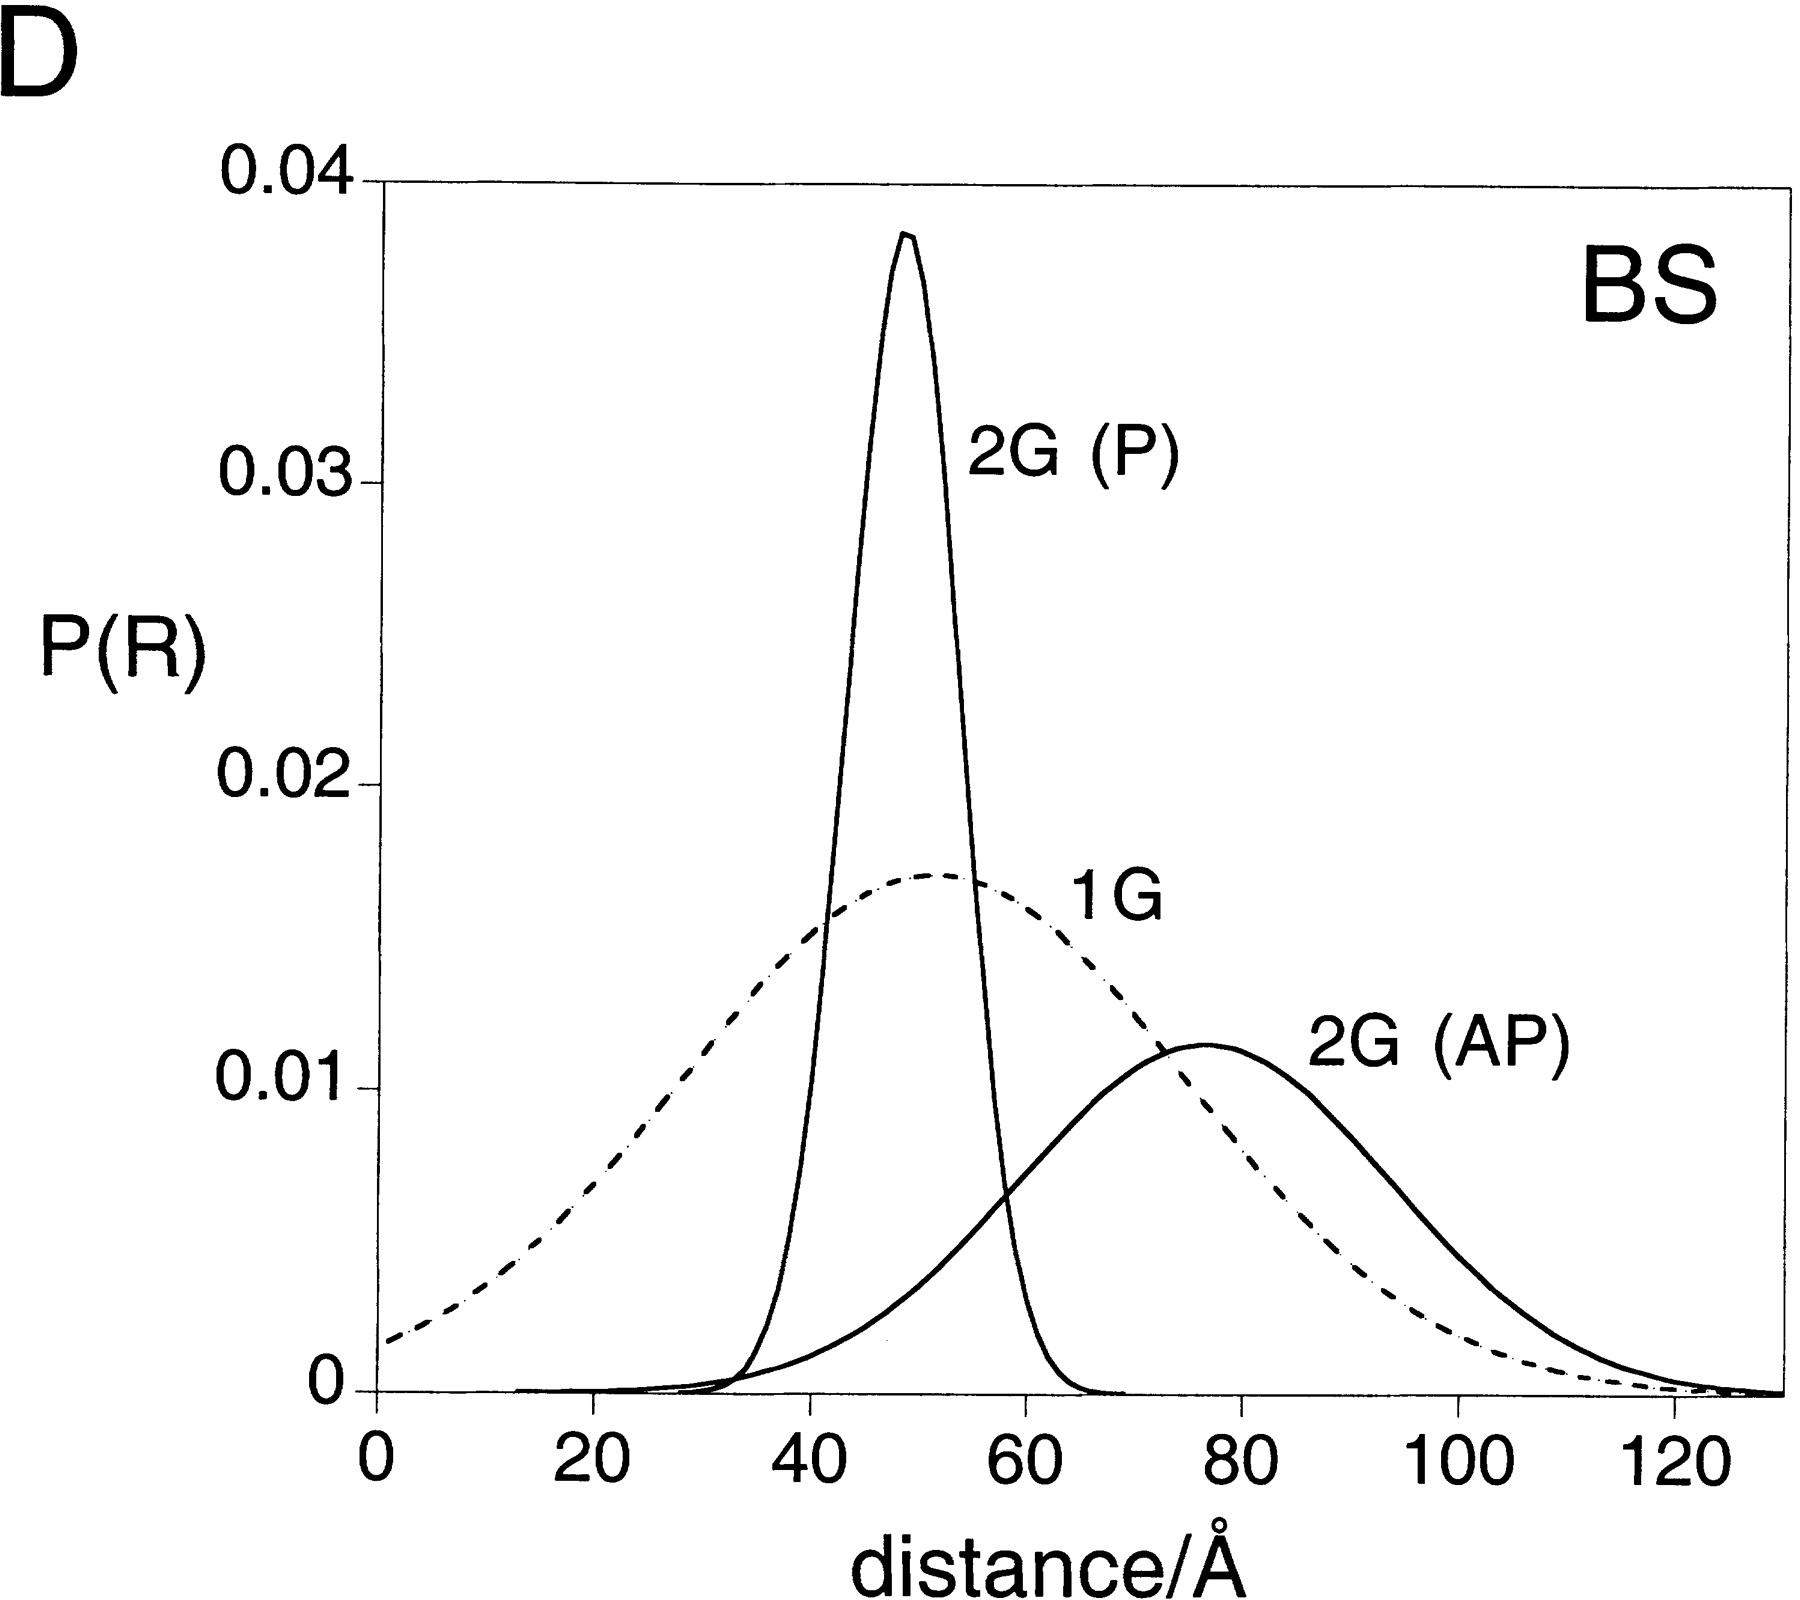
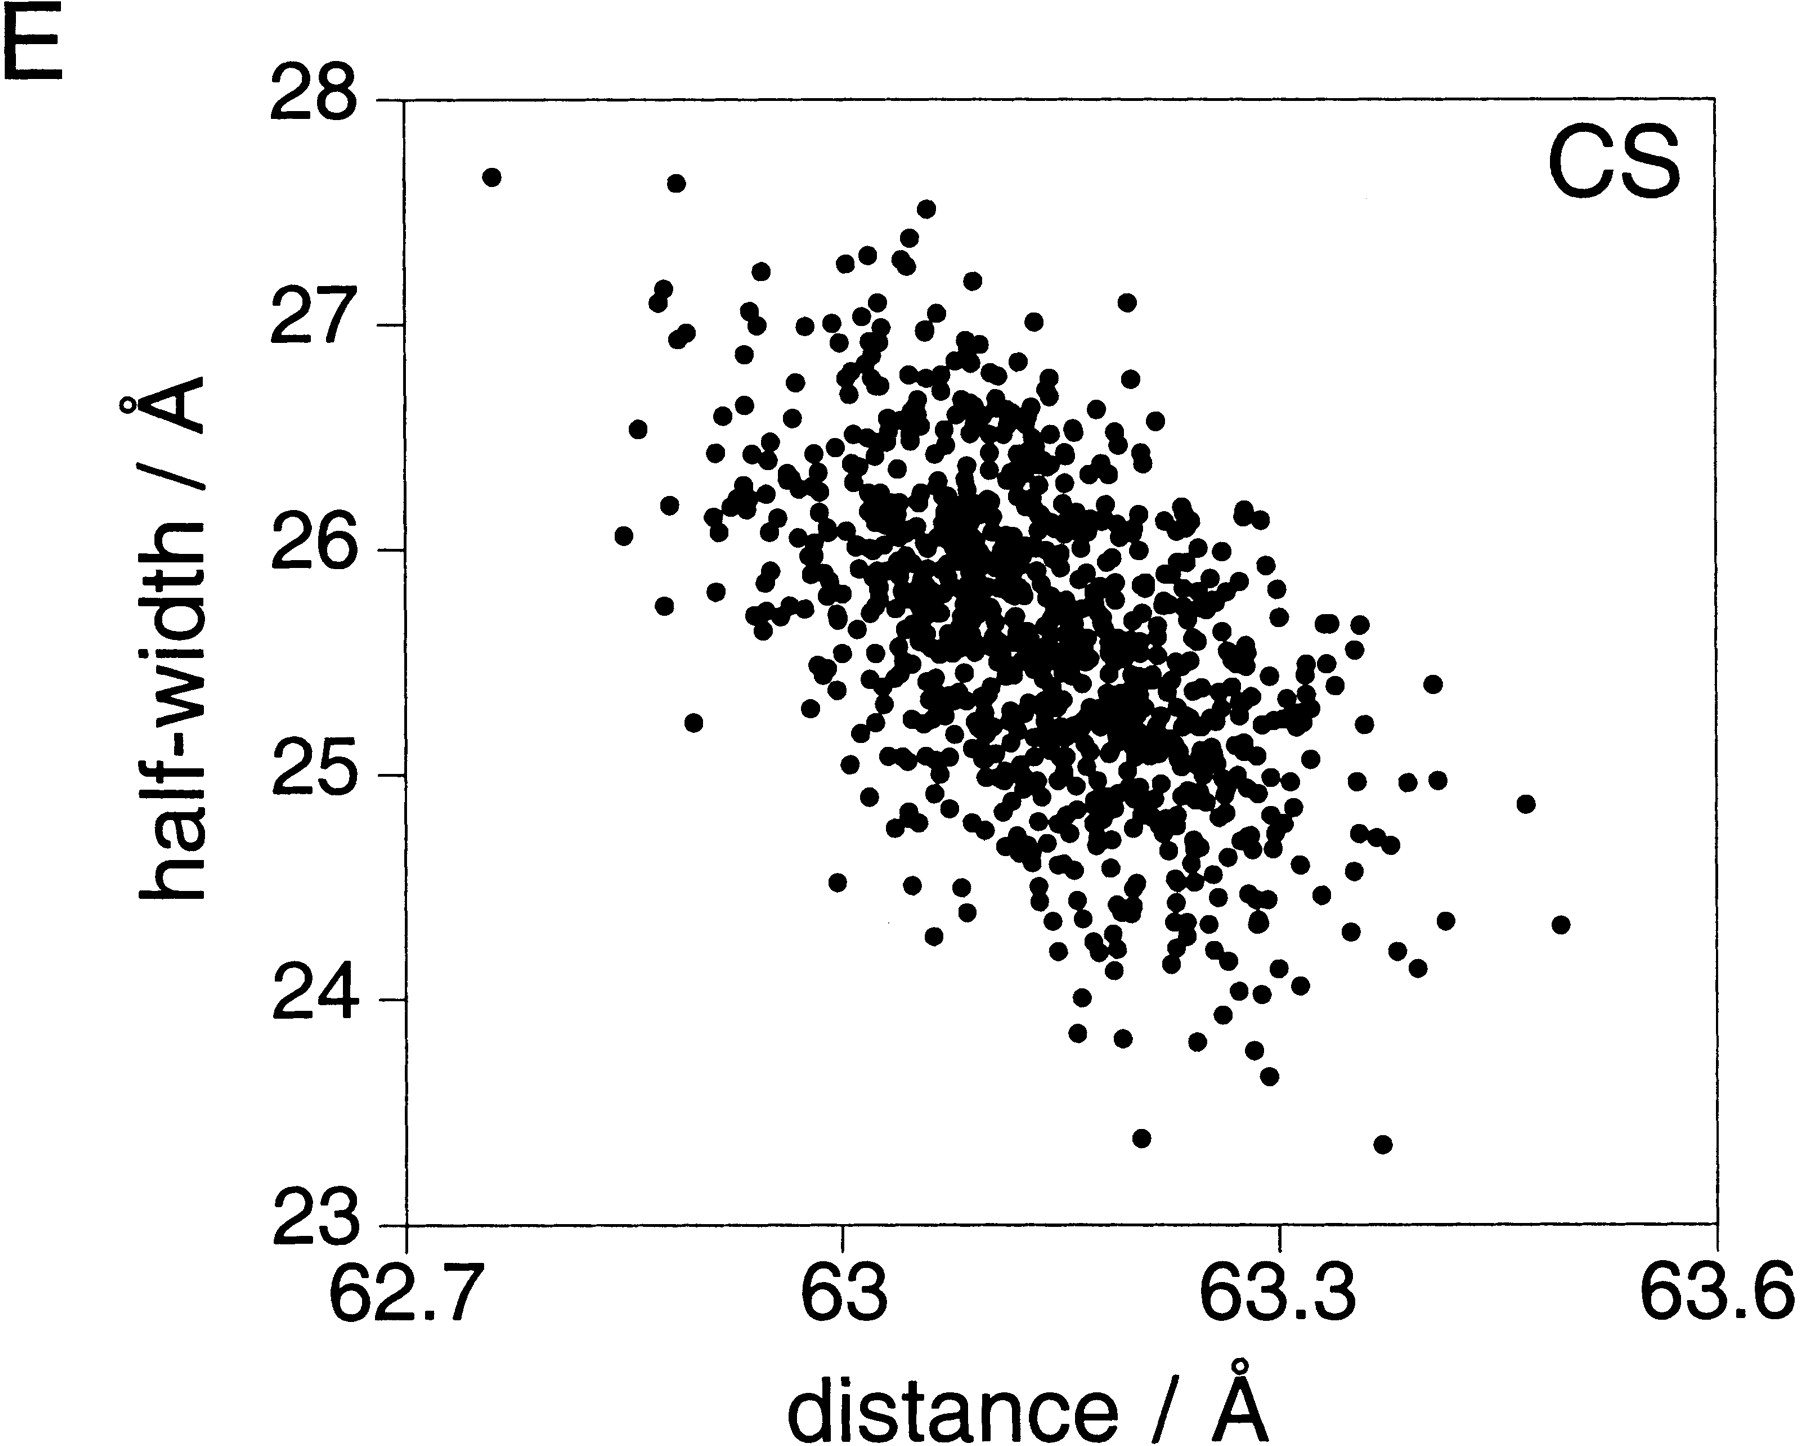
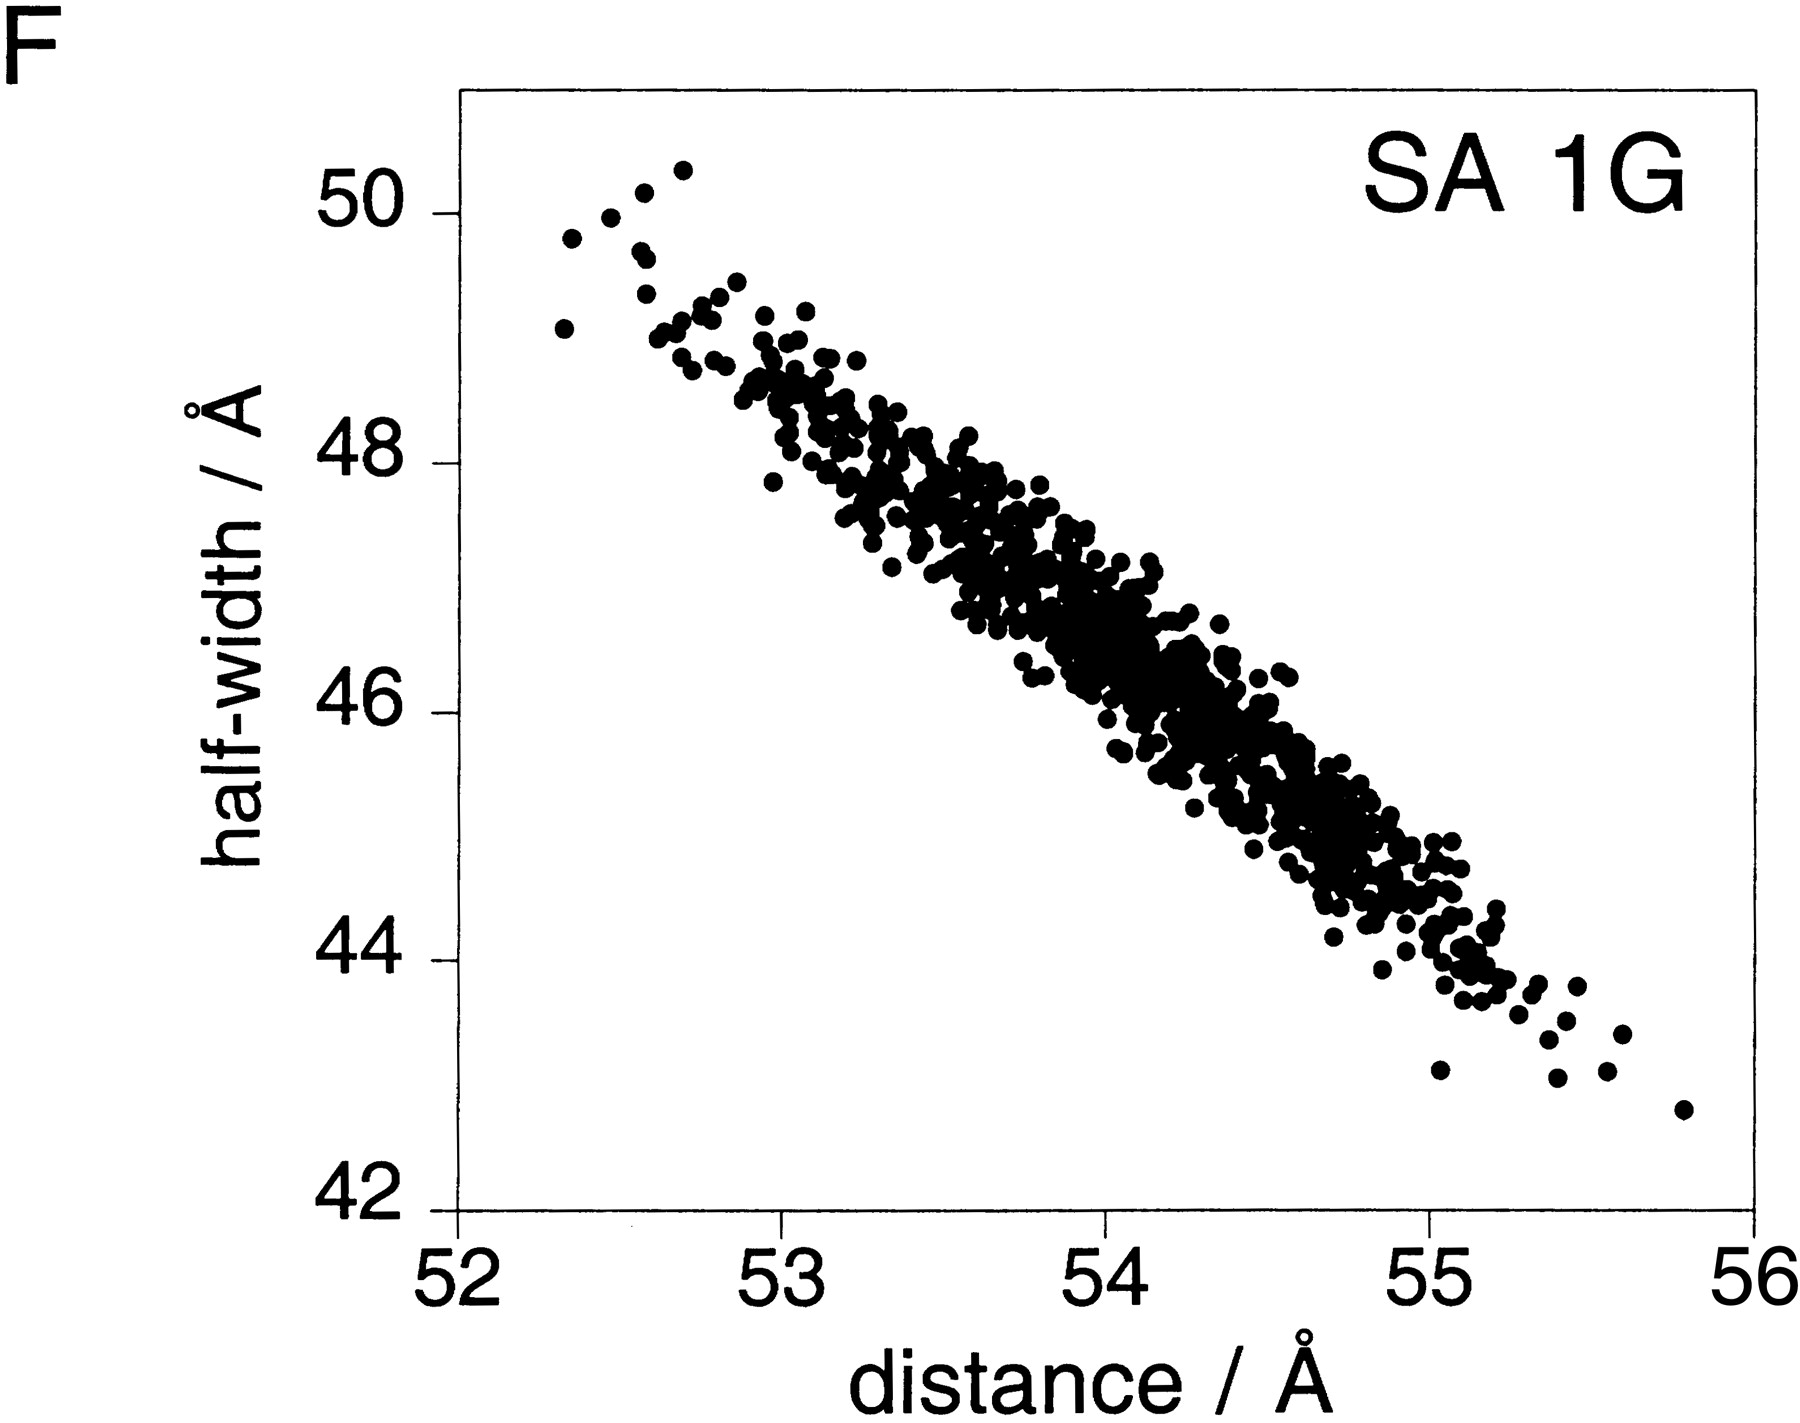
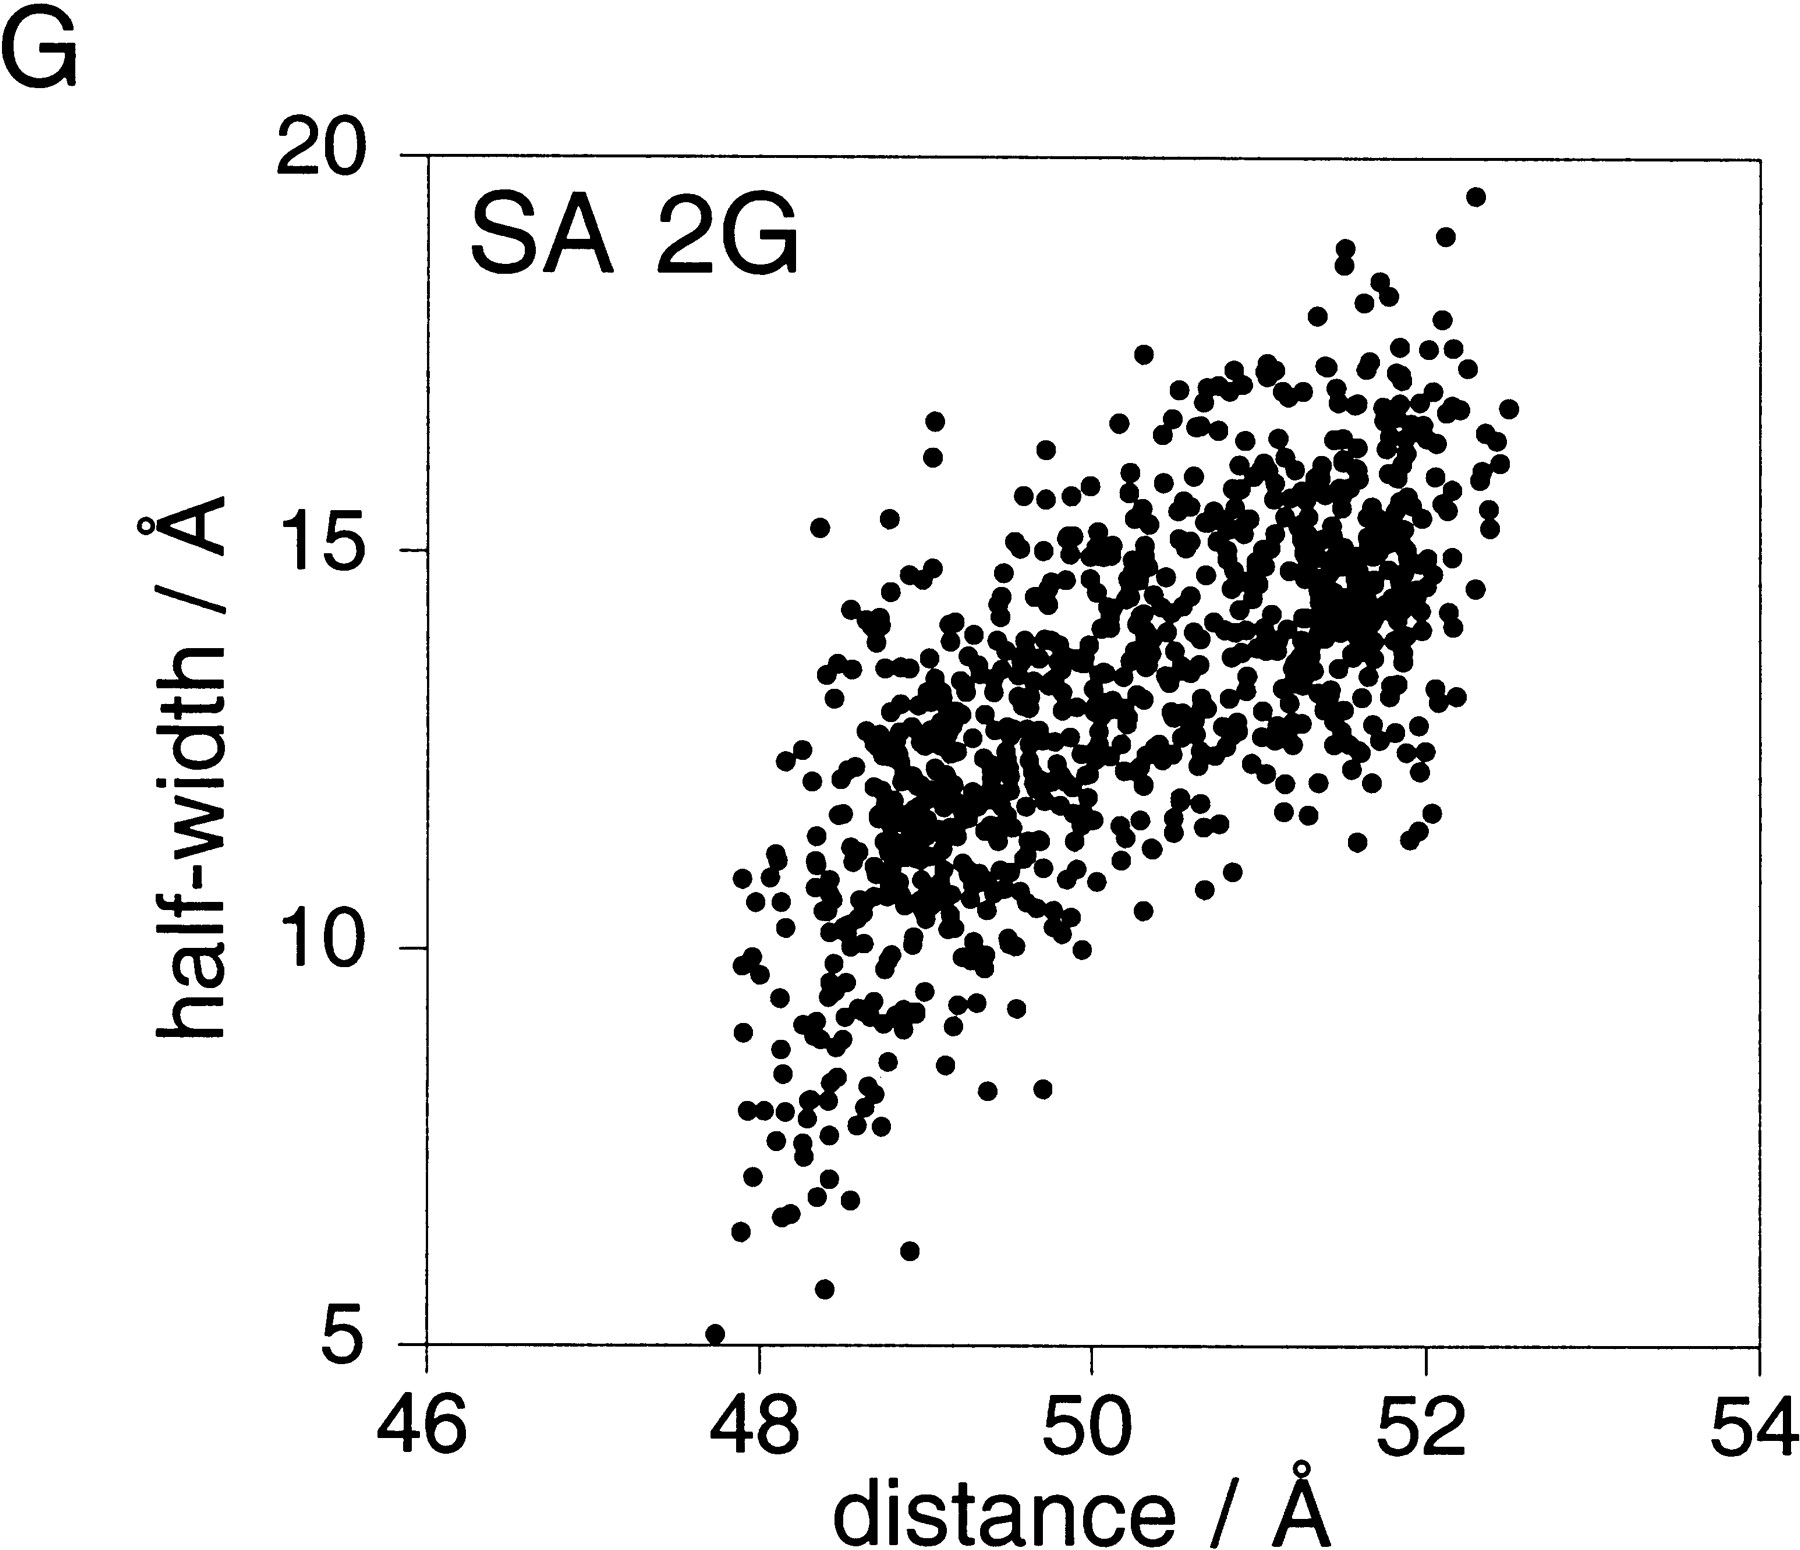
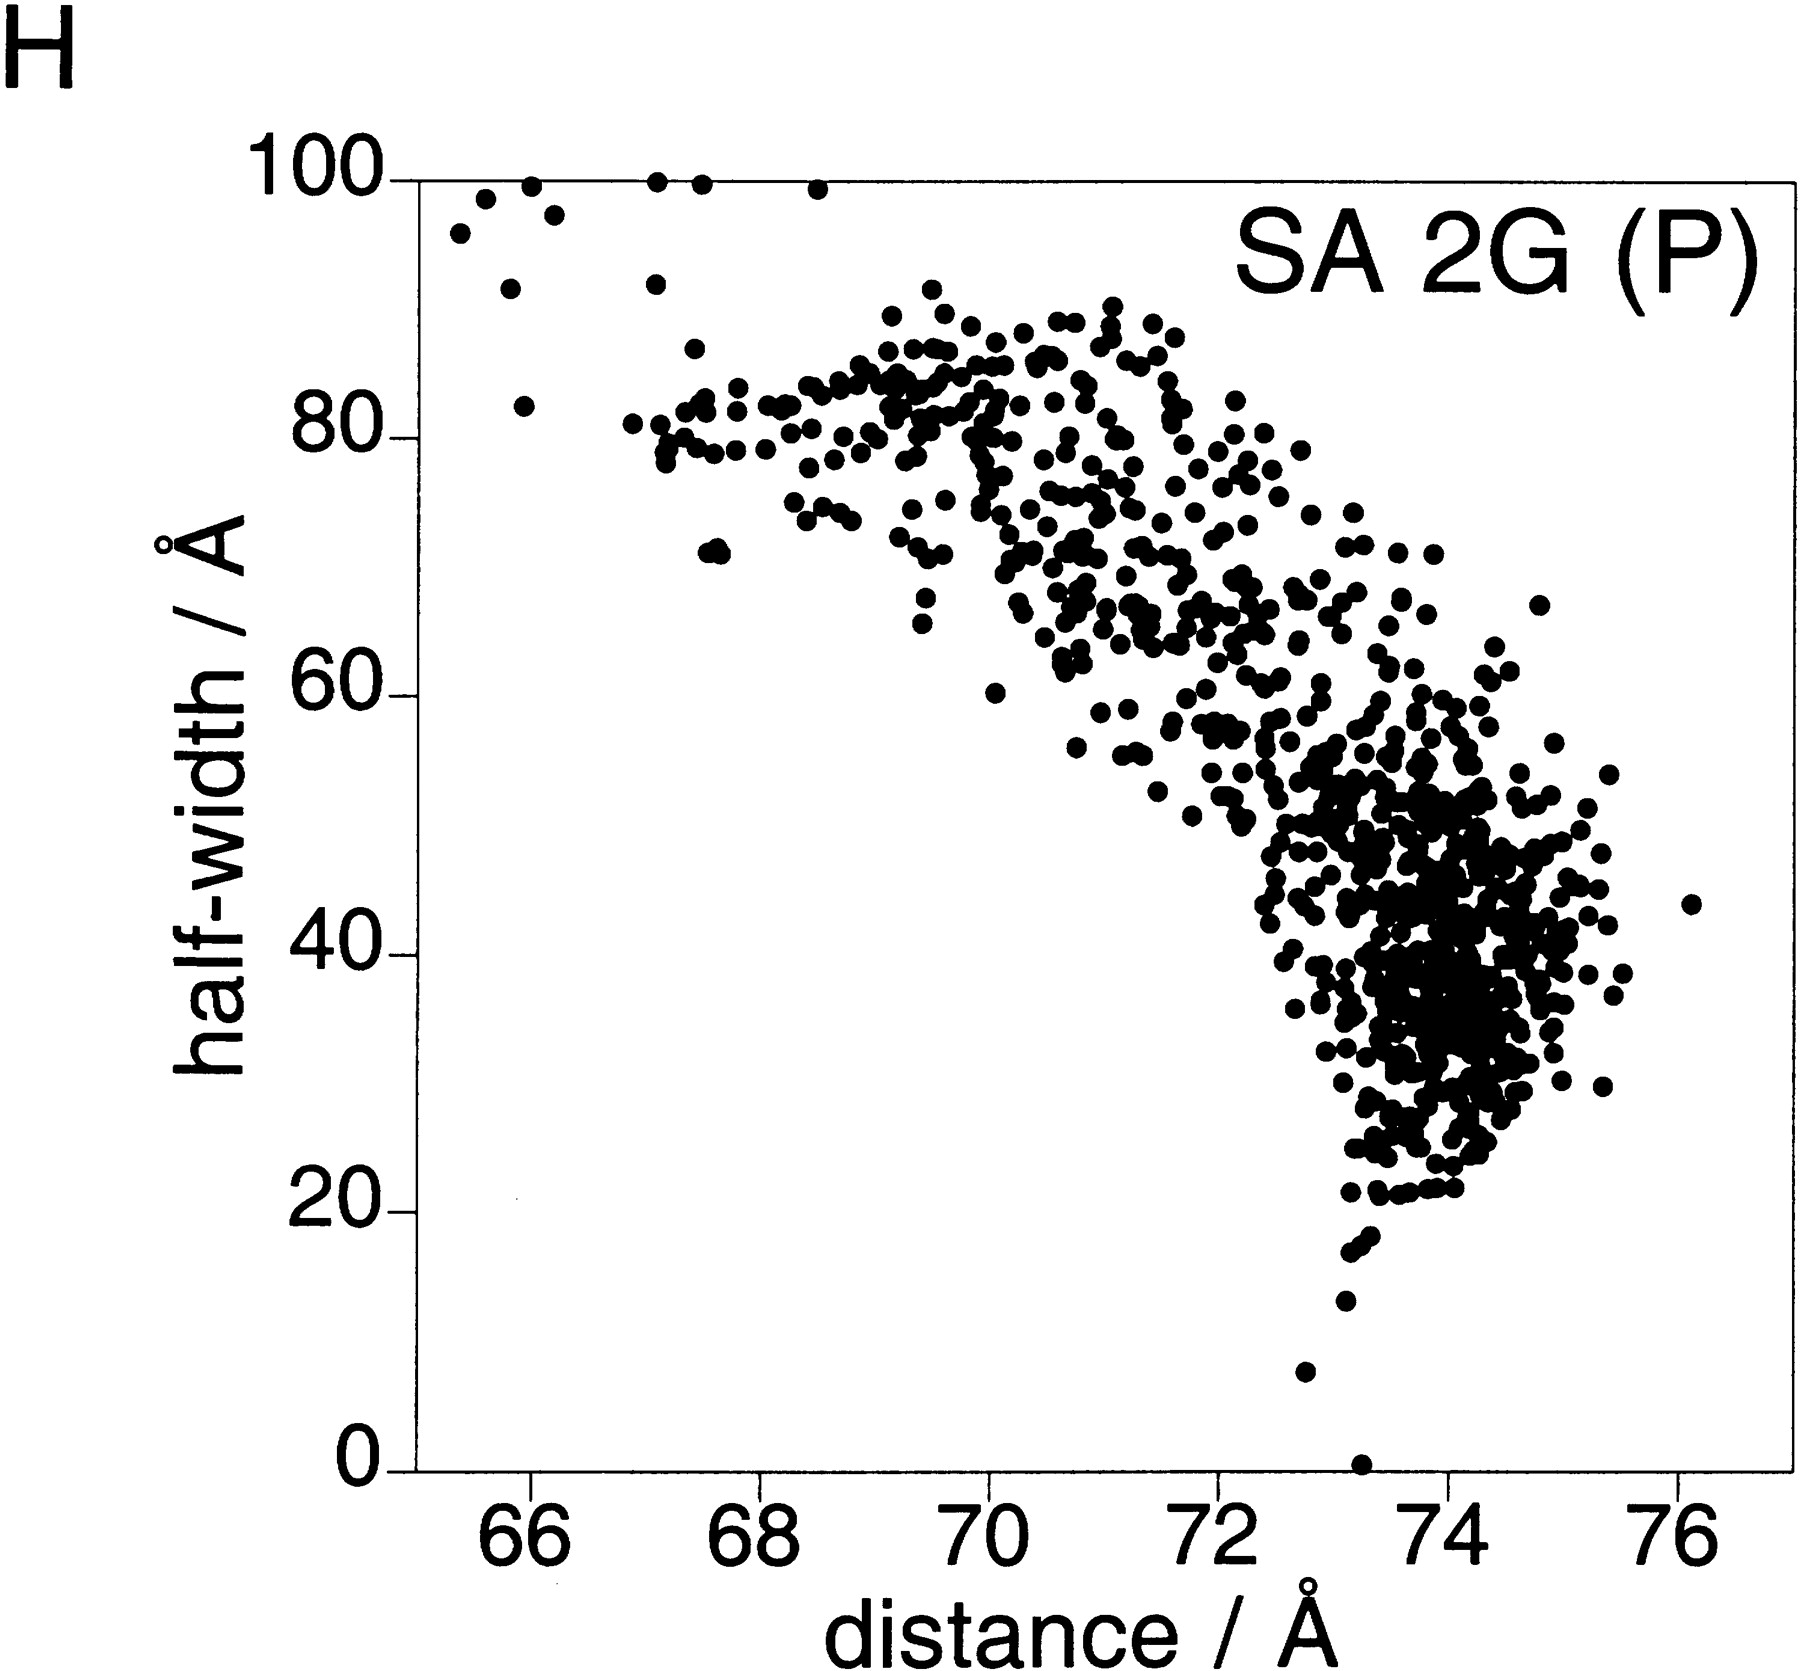
Analysis of D-A distance distributions by time-resolved fluorescence measurements. (A) Plots of phase shift and demodulation of the fluorescence emission of the CS (open circles) and SA (closed circles) vectors in the presence of 1 mM Mg2+ as a function of the frequency of intensity modulation of the excitation. The best fits of CS to a single distribution of D-A lengths and SA to two distributions are shown as solid lines. The single distribution fit of SA is also shown as a broken line. (B) The resulting residuals for the phase and modulation of the fits in part A are shown. A single Gaussian fit for CS is compared with the single- (SA-1G) and two- (SA-2G) Gaussian distribution fits to SA. (C) Single-Gaussian D-A distance distribution retrieved from the fit (Table 2A) for the duplex control (dotted line) and the stacked vectors, BA (dashed line), and CS (solid line). Areas are unity, lowering the heights of the wider distributions. (D) Two-Gaussian (2G) distance distributions for the BS vector (solid) as compared with a single-Gaussian (1G, dotted). Fit values are listed in Table 2, A and B. Areas for the two Gaussian distributions sum to unity; each distribution has an area of 0.5, corresponding to a 1:1 ratio of parallel (P) and antiparallel (AP) species. The area for the single-distance fit is unity. (E–H) Scatter diagrams showing the distribution of acceptable fits from Bootstrap error analysis. The scatter diagrams present the population of acceptable distances and half-widths. Nine hundred Bootstrap cycles are represented in each case. (E) Analysis for the single Gaussian fit for the CS vector. (F) Analysis for the single Gaussian fit for the SA vector. (G) Analysis for the two-Gaussian distance distribution (shorter distance, corresponding to the antiparallel conformer) for the SA vector. (H) Two-Gaussian distribution (longer distance, parallel conformer) for the SA vector.




