


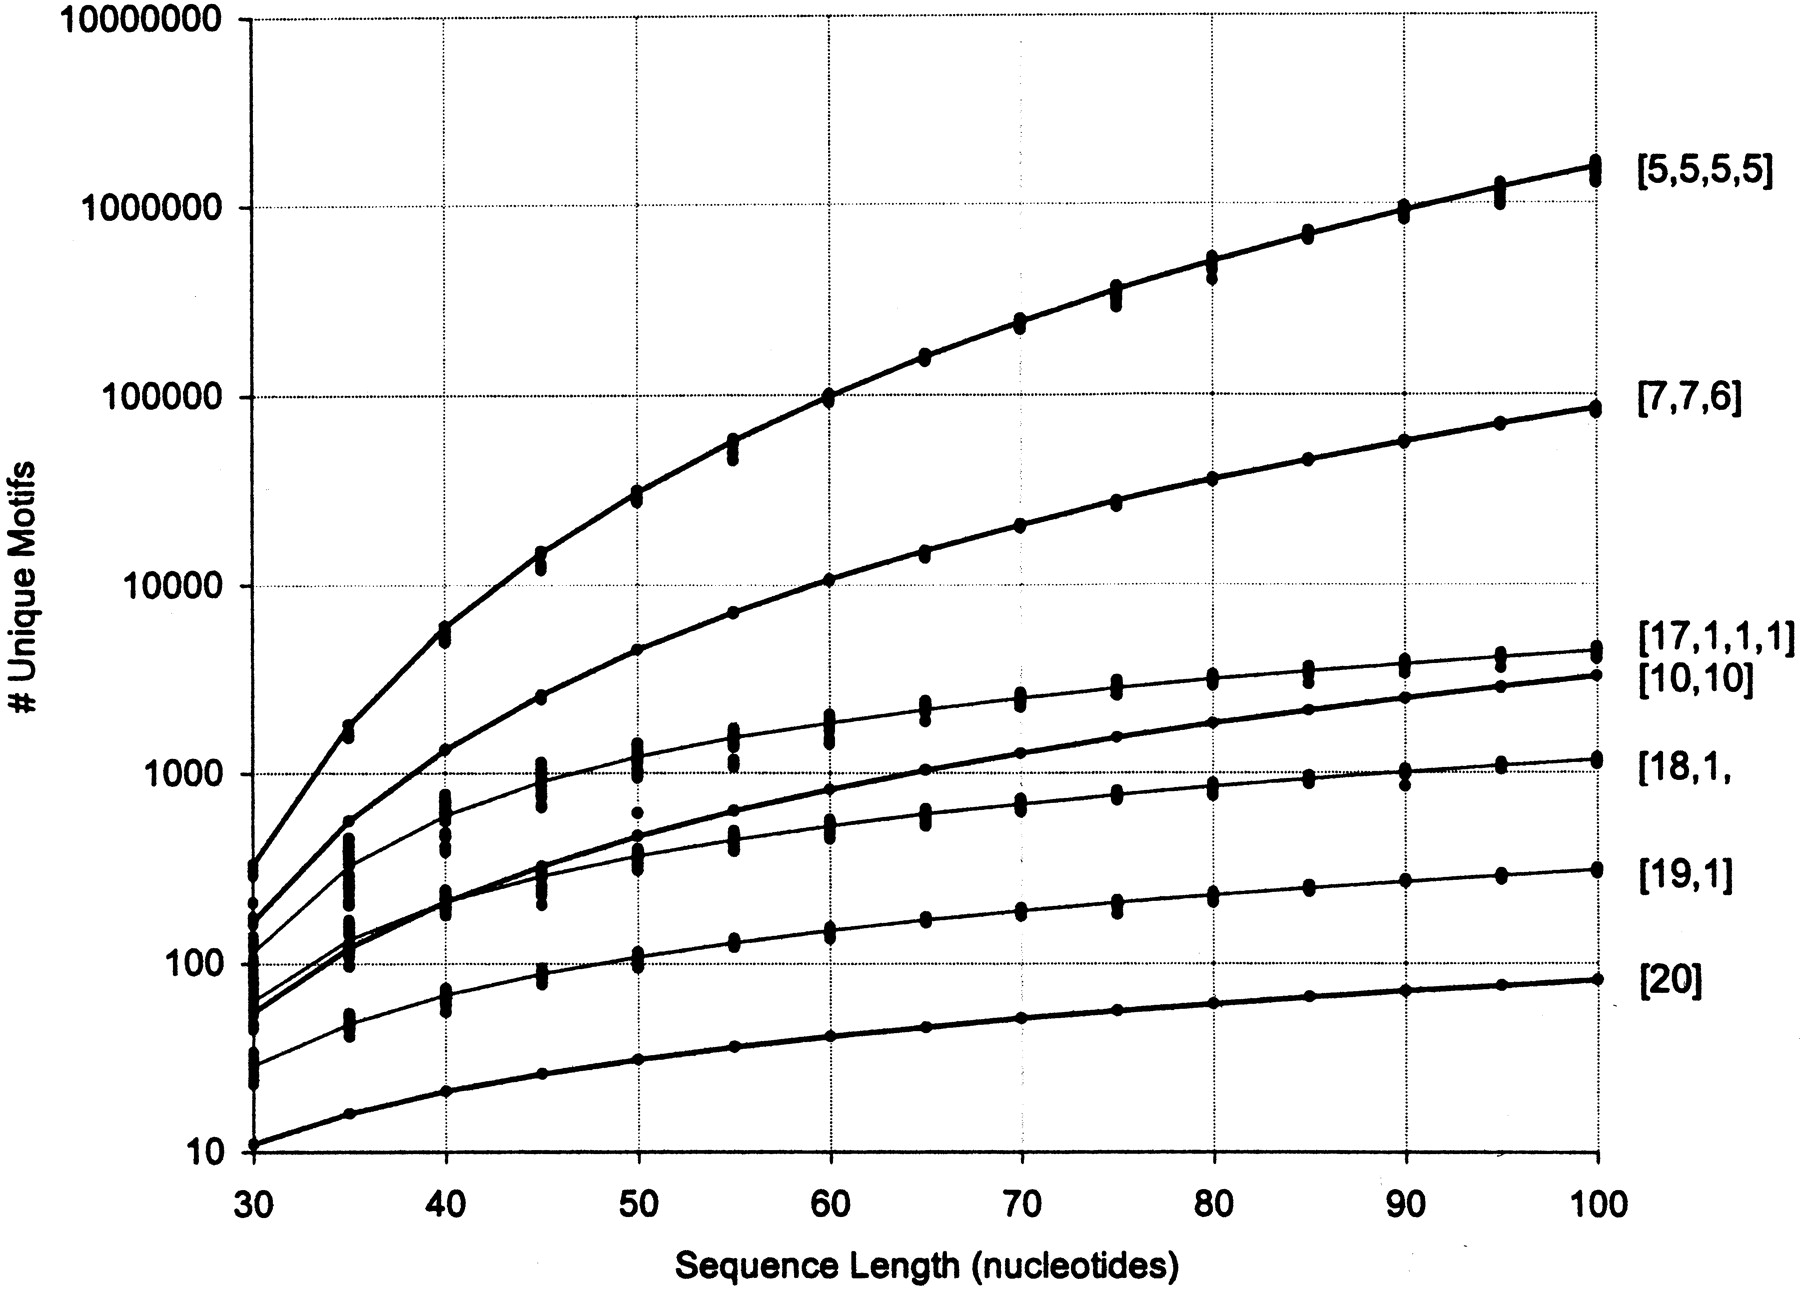
Agreement between calculations and simulations. The number of unique motifs (i.e., sequences that differ in at least one module, y-axis) grows dramatically as the sequence length, x-axis, and modularity grow, although not as fast as does the number of trials (cf. Fig. 2). Lines are the results of the calculations as derived in Materials and Methods; dots are 25 runs of simulations in which randomly generated sequences were divided into modules in every possible way for a given length and configuration. Dark lines denote evenly divided motifs (e.g., [5,5,5,5] represents a motif of 20 divided into four equal modules); light lines denote unevenly divided motifs (e.g., [17,1,1,1] represents a motif of 20 divided into four modules in which the difference between the largest and smallest modules is as great as possible). Note the dramatic effect (orders of magnitude) of unequal division of the motif. The spread of the dots (each from an individual random sequence) gives an idea of the sampling error: large for short sequences and high modularity; very low once the sequence reaches 60 nucleotides. The model gives excellent agreement with the simulations over a wide range of modularity, sequence length, and size of individual modules. It is impractical to collect simulation data for longer sequences due to the running time (approx. 6 h and 500 MB RAM for modularity 4 and sequence length 100 on a 1.8 GHz Pentium 4; more than 4 d and 4 GB RAM/swap space for sequence length 200).




