


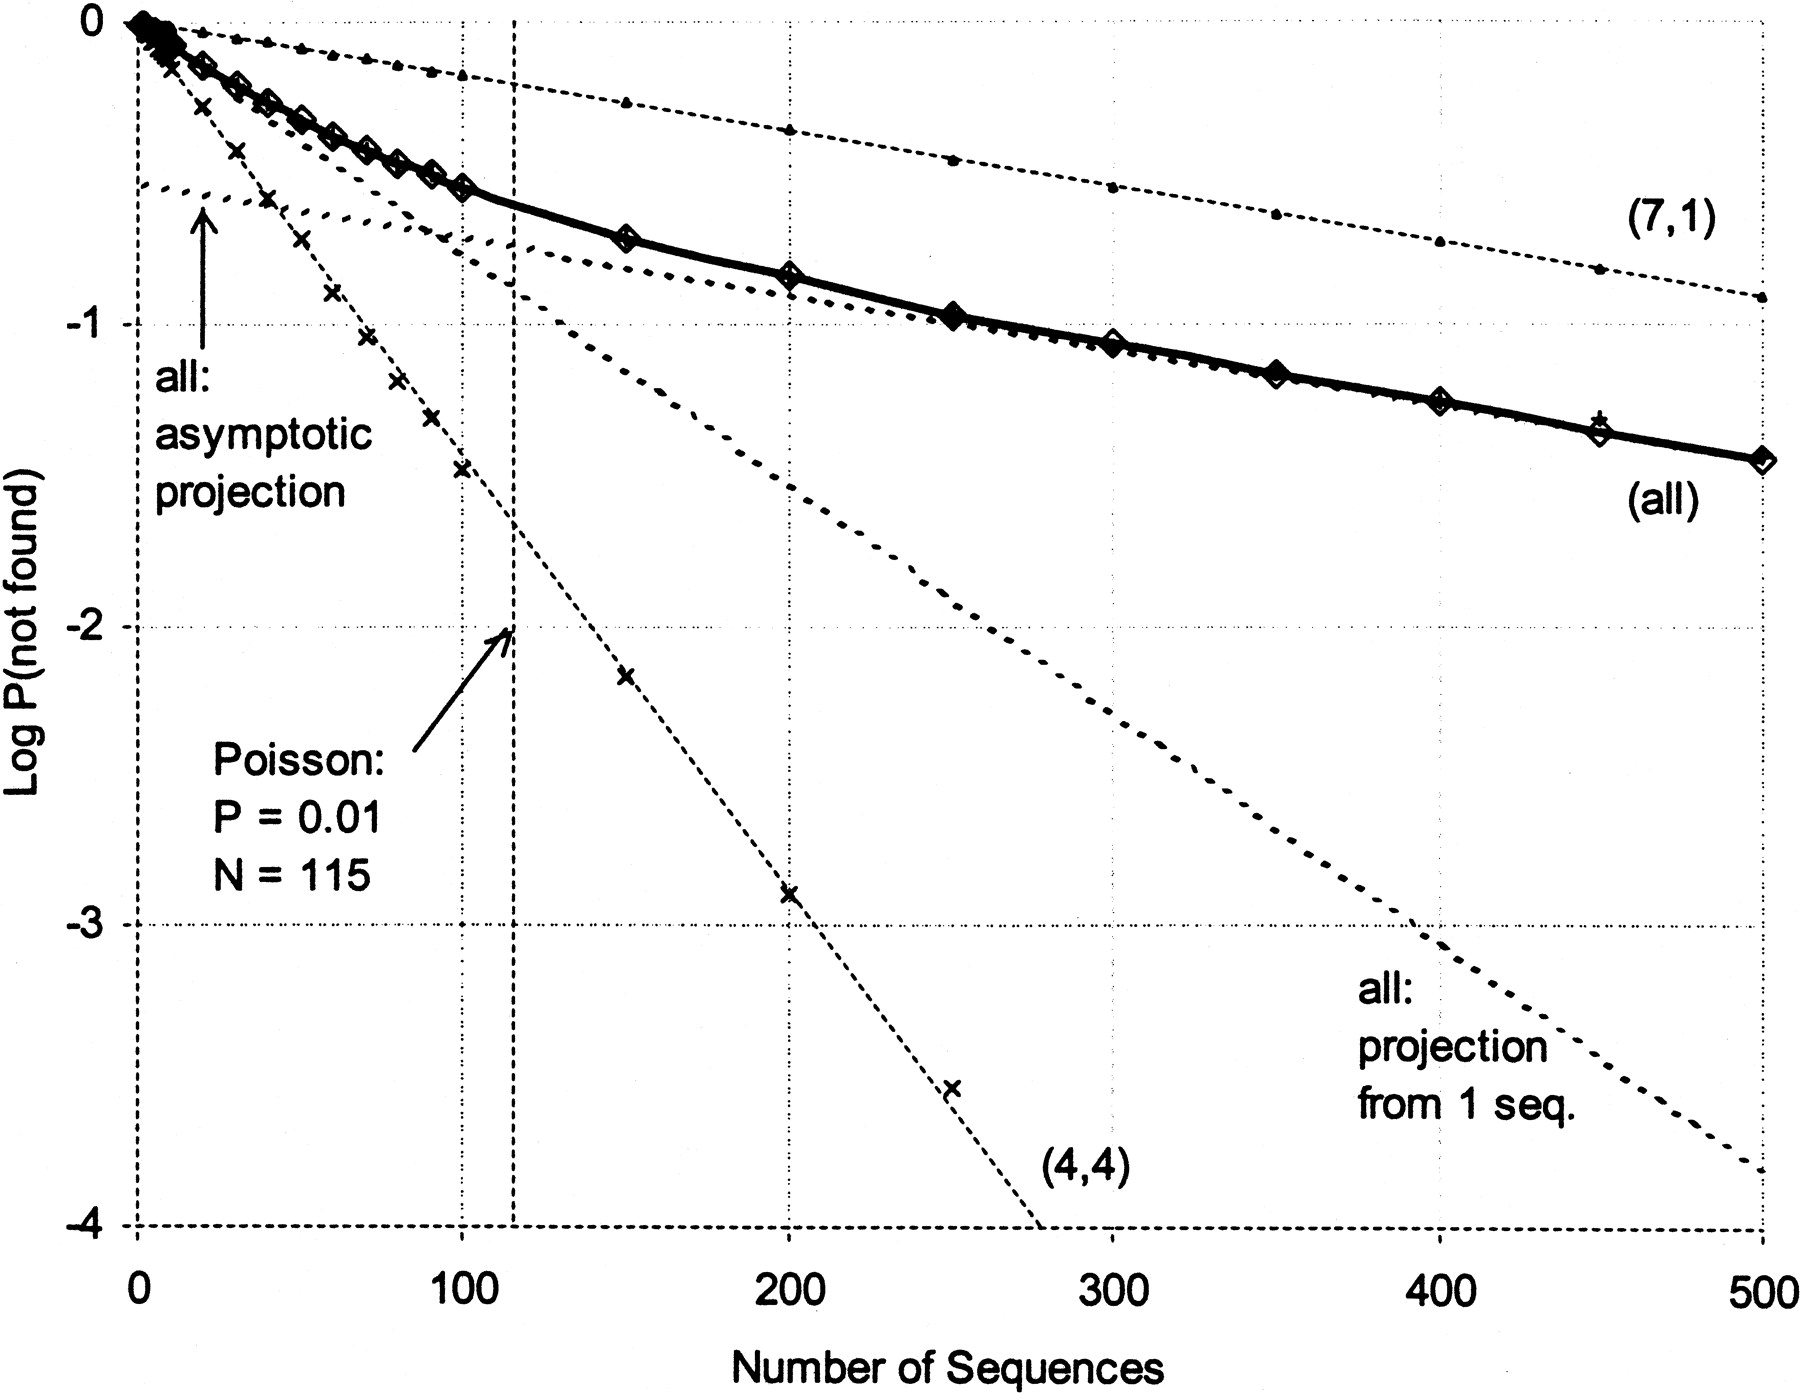
Violation of Poisson sampling assumptions. Dividing a motif of constant modularity into pieces affects the number of sequences that need to be searched to minimize the probability that a motif will be missed (logP, y-axis: logP[not found] of −2 is equivalent to a 99% chance that the motif is found). The vertical line at 115 sequences is the Poisson prediction for a 99% chance of finding an 8 mer divided into two pieces in a random region of length 80. Thin solid lines show the progression for the fastest-changing [4,4] and slowest-changing [7,1] and [1,7] configurations: independent sequences have a constant probability of finding each motif, and so the relationship is log-linear. The thick solid line shows the probability of missing a sequence when all configurations of the motif (all divisions into two modules) are combined: the nonlinearity shows that the results for a single sequence do not scale to multiple sequences, because different configurations saturate at different rates. This line is derived from two runs of the simulation (diamonds and crosses). Dashed lines show extrapolation for the combined configurations either from the results for a single sequence (steeper slope) or from 500 sequences (shallower slope). Note the large discrepancy (two orders of magnitude) between the projection from a single sequence and the actual results for a sample of 500 sequences.




