


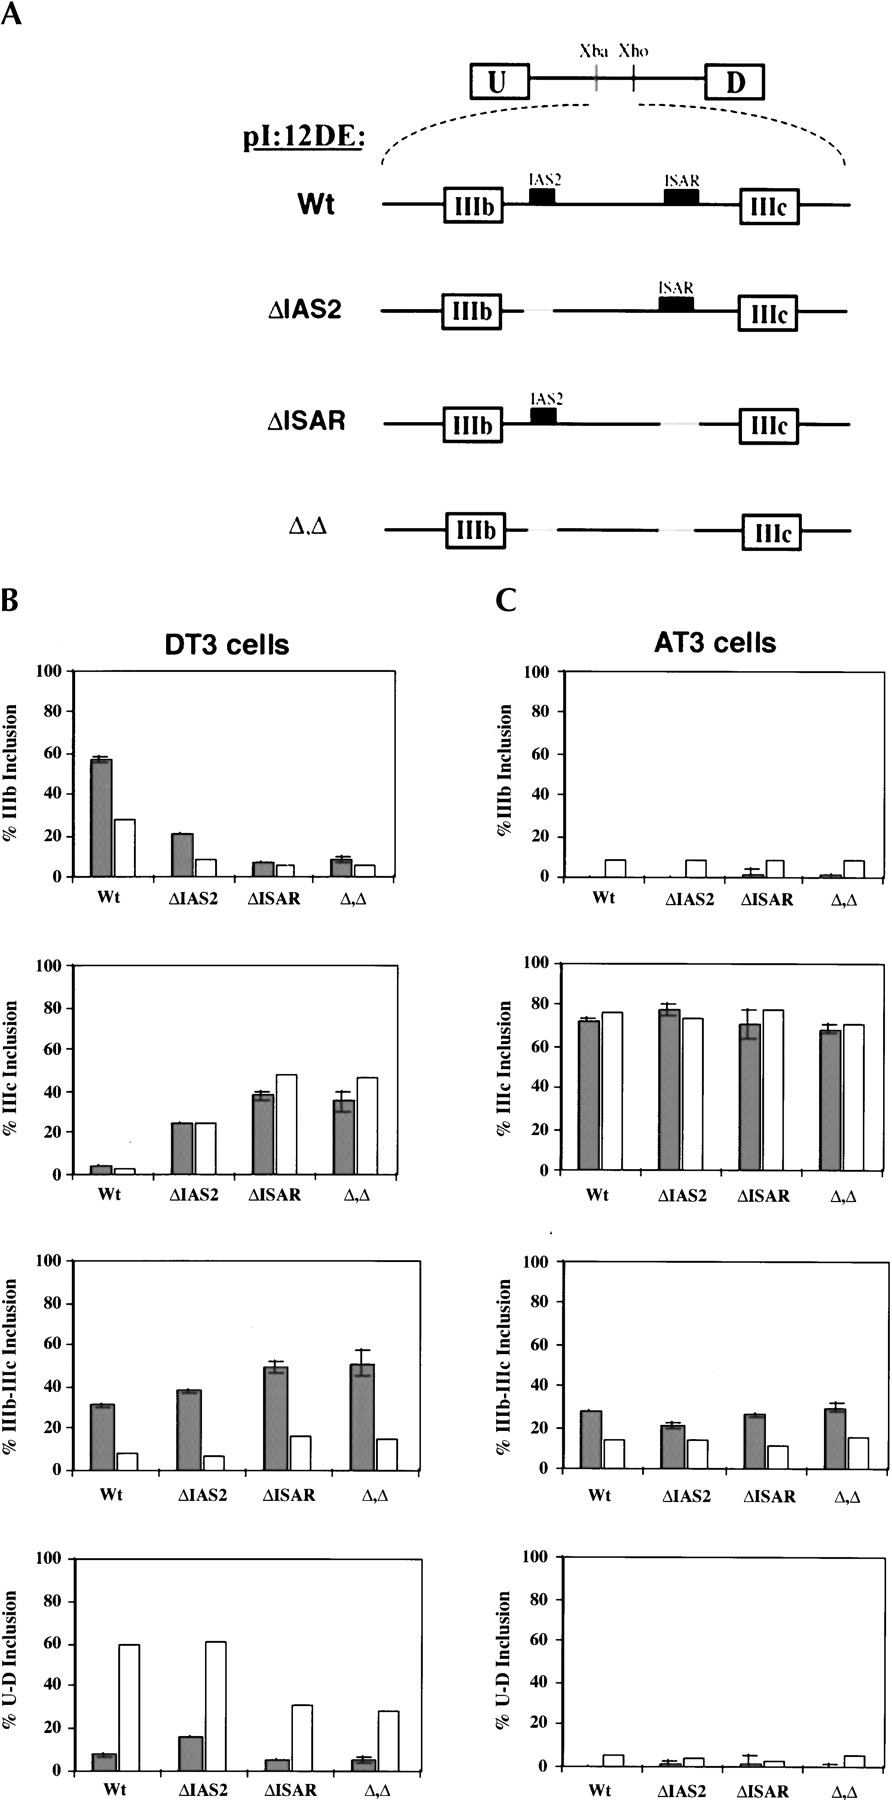
Quantification of alternatively spliced FGFR2 transcripts. (A) Schematic of double-exon minigene constructs used to study the cell-type-specific inclusion of exons IIIb and/or IIIc. The presence or absence of IAS2 and ISAR is indicated. These minigenes can direct the expression of four RNAs produced by alternative splicing: skipping of IIIb and IIIc yields U-D RNA, inclusion of either IIIb or IIIc yields U-IIIb-D or U-IIIc-D, respectively, and double inclusion yields U-IIIb-IIIc-D. (B) DT3 cells and (C) AT3 cells were transfected with the minigene constructs in A. Total RNA was extracted and analyzed with either the Invader RNA assay (gray bars) or semiquantitative RT-PCR (white bars) for the presence of the four RNA variants. Error bars for the Invader RNA assay data represent one standard deviation. In B and C the percent inclusion of a product (e.g., U-IIIb-D) among transcripts was calculated as follows: percent product (e.g., U-IIIb-D) inclusion = {[product (e.g., U-IIIb-D)]/([U-D] + [U-IIIb-D)] + [U-IIIc-D] + [U-IIIb-IIIc-D])} × 100.




