


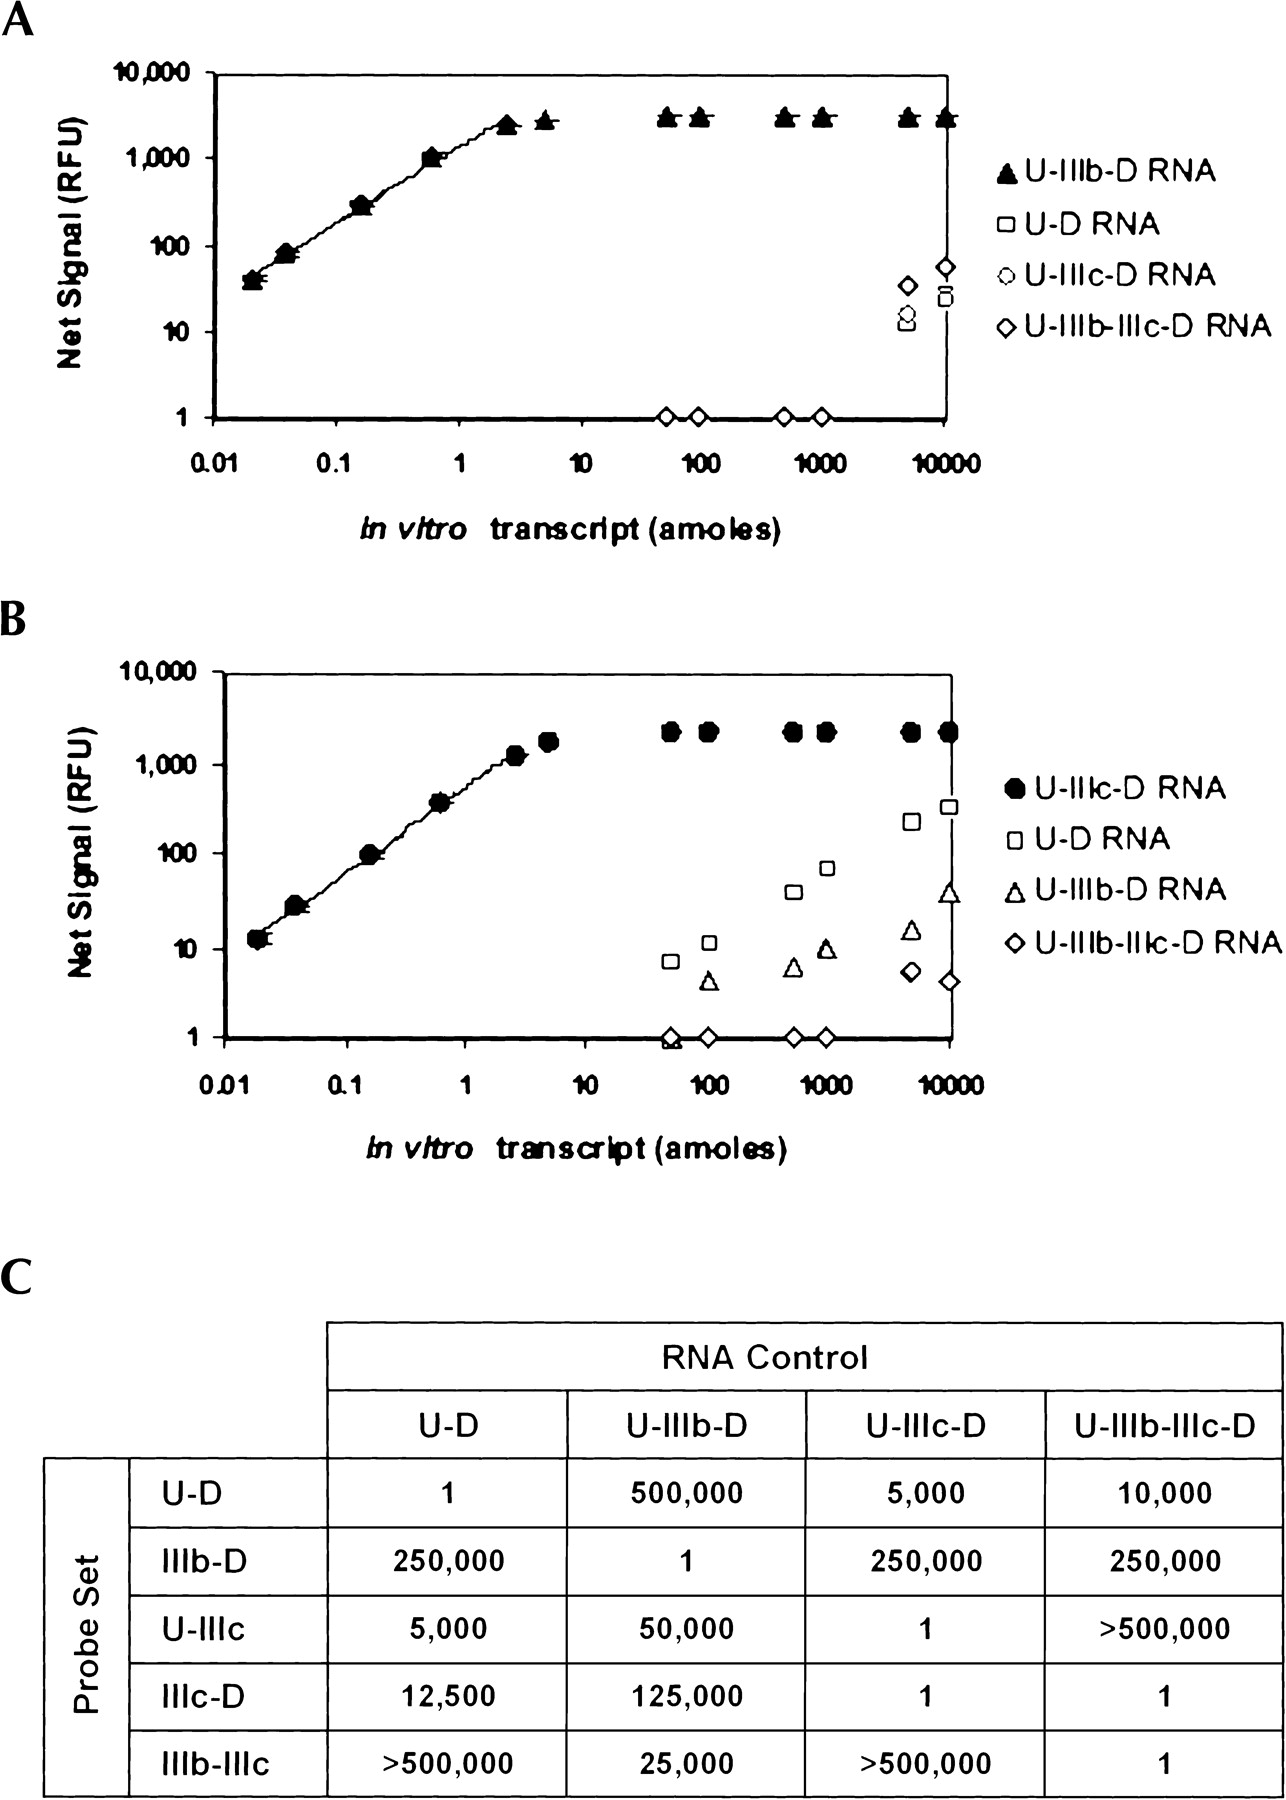
The Invader RNA assay discriminates between alternatively spliced FGFR2 transcripts. (A, B) The Invader RNA assay, using the IIIb-D (A) or the U-IIIc probe set (B), was carried out with increasing levels (0.01–10,000 amole) of the four variant RNAs (Fig. 2). Linear regression (R2) values for the fitted regions of the data are 0.992 and 0.998 for IIIb-D and U-IIIc, respectively. Error bars represent one standard deviation. (C) Table of the discrimination capability of the five probe sets on the four RNA variants. The discrimination capability for each probe set was calculated by dividing the highest target level in which no significant signal was detected for another RNA variant by the limit of detection for the probe set being tested. Values listed represent the inverse of the discrimination capability (e.g., the IIIb-D probe set has a limit of detection of 0.02 amole and it detects background signal from the U-D transcript at 5,000 amole: 5,000/0.02 = 250,000 discrimination level).




