


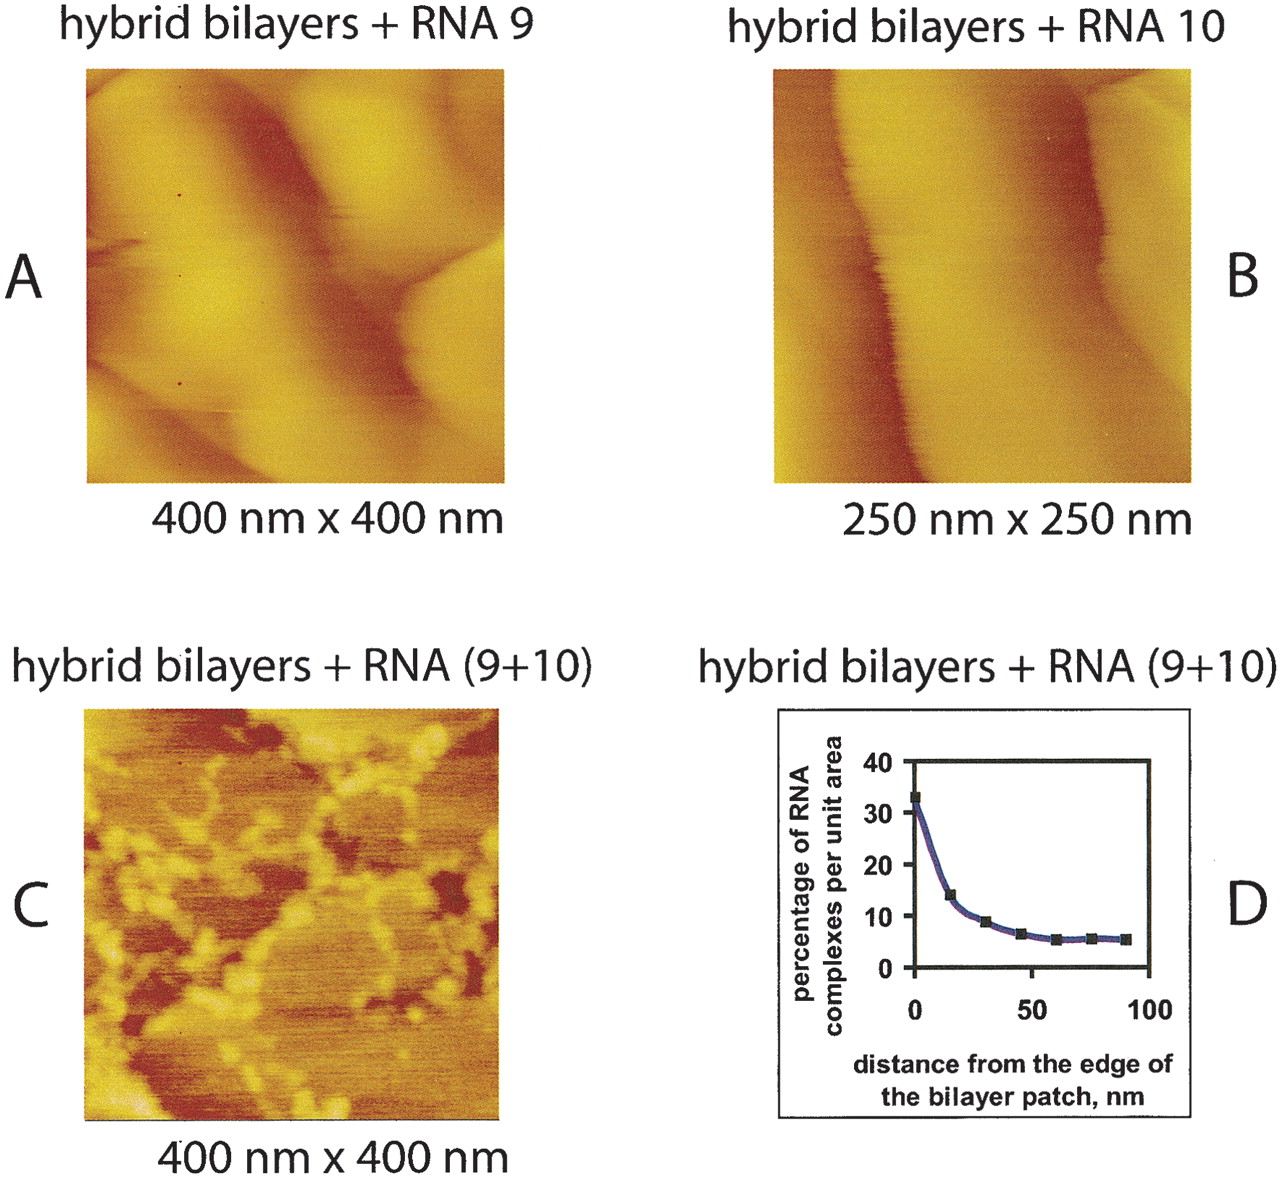
FIGURE 5.
Atomic force microscopy images of hybrid lipid bilayer surface incubated with RNA 9 (A), RNA 10 (B), and RNA (9 + 10) at RNA 9/RNA 10 mole ratio equal 2 (C), and percentage of area as RNA (9 + 10) complexes as a function of the distance from the edge of a patch of bilayer (D). Below AFM panels, the full size of the field is indicated so objects may be sized.




