


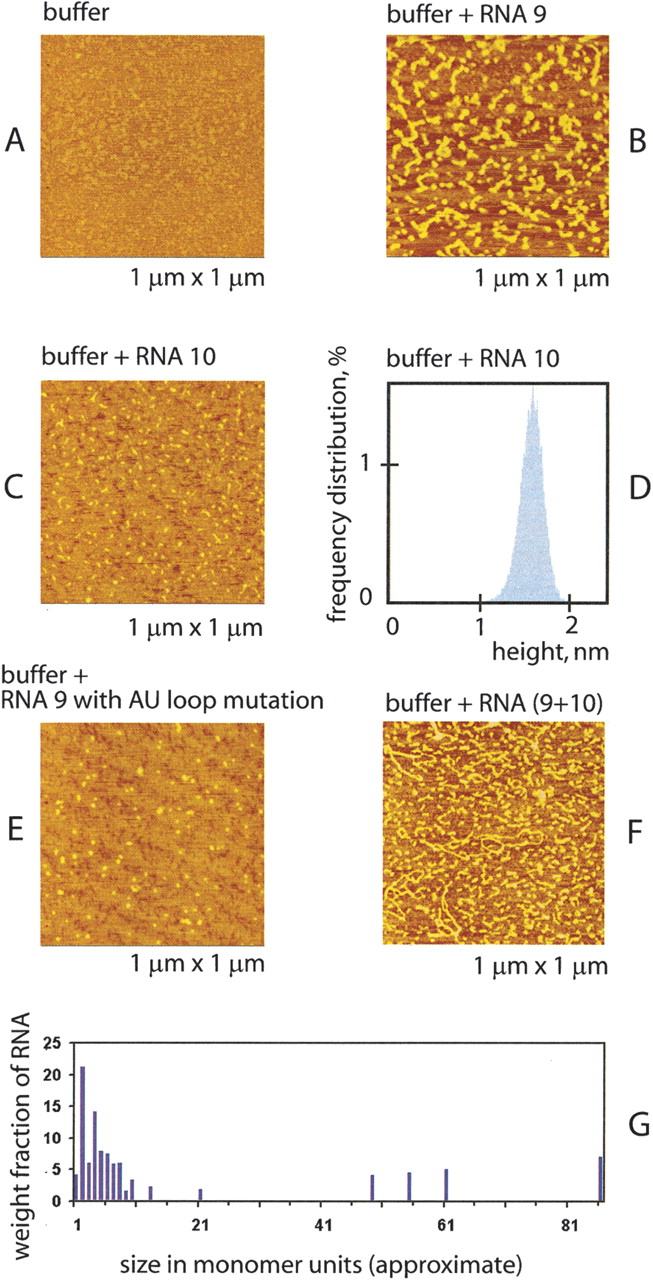
FIGURE 4.
Atomic force microscopy images of mica surface incubated with buffer (A), RNA 9 (B), and RNA 10 (C); frequency distribution of the height of RNA 10 (D); AFM images of mica surface incubated with RNA 9 with AU loop mutation (E) and RNA (9 + 10) at RNA 9/RNA 10 mole ratio equals 2 (F); and distribution of the weight fraction of RNA aggregates in panel F (G). Below each AFM panel, the exact size of the field is indicated so particles can be sized.




