


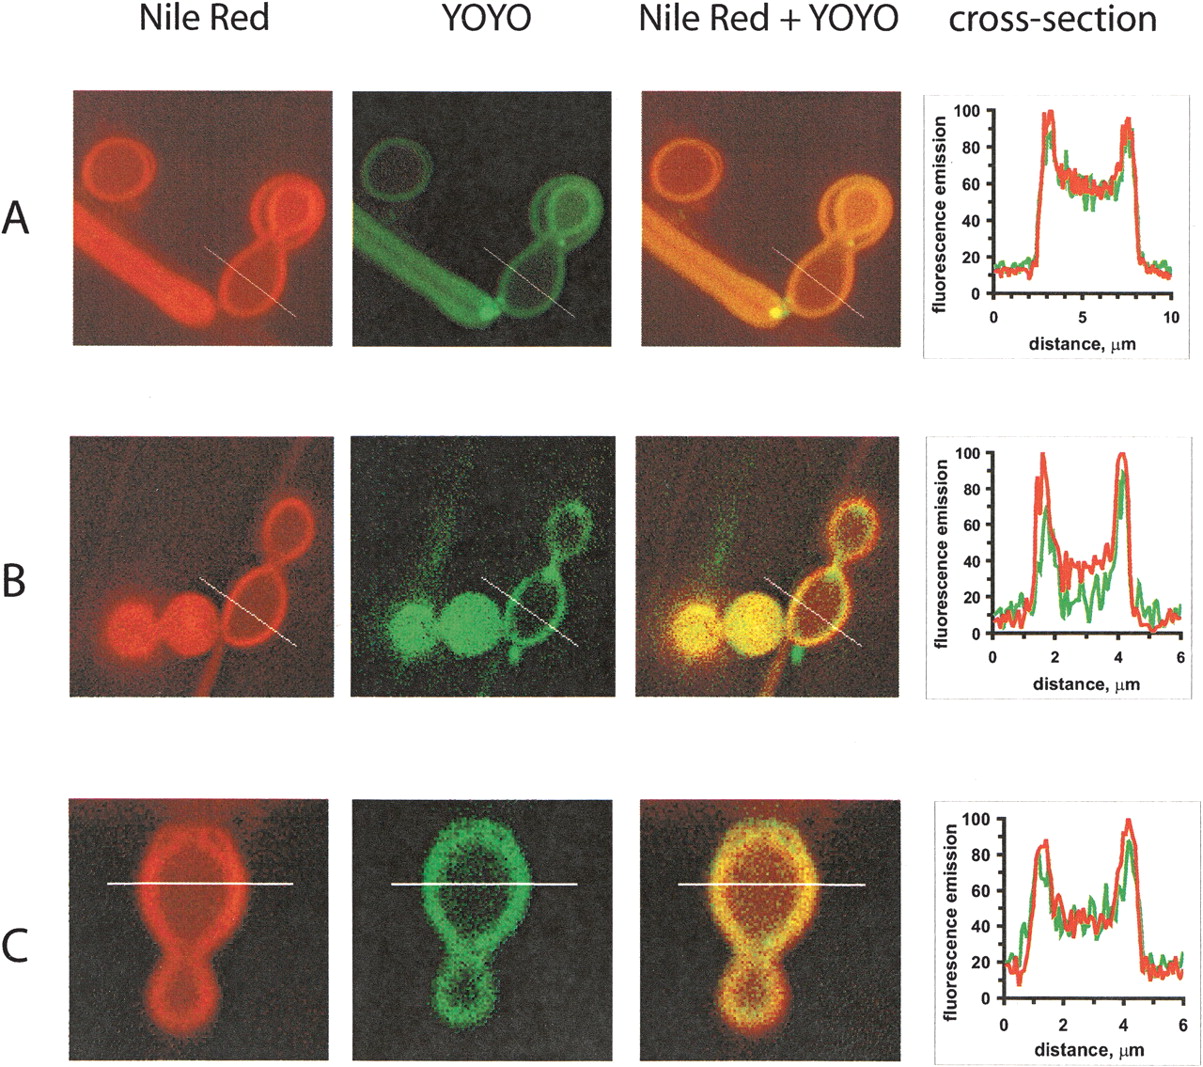
FIGURE 2.
Fluorescence microscopy (A, B, C) of large lipid vesicles (membrane visualized by Nile Red) incubated with RNA 9:9:10 complexes at RNA 9/RNA 10 mole ratio equal 2 (RNA visualized by YOYO-1), and fluorescence intensities along the diagonal bars.




