


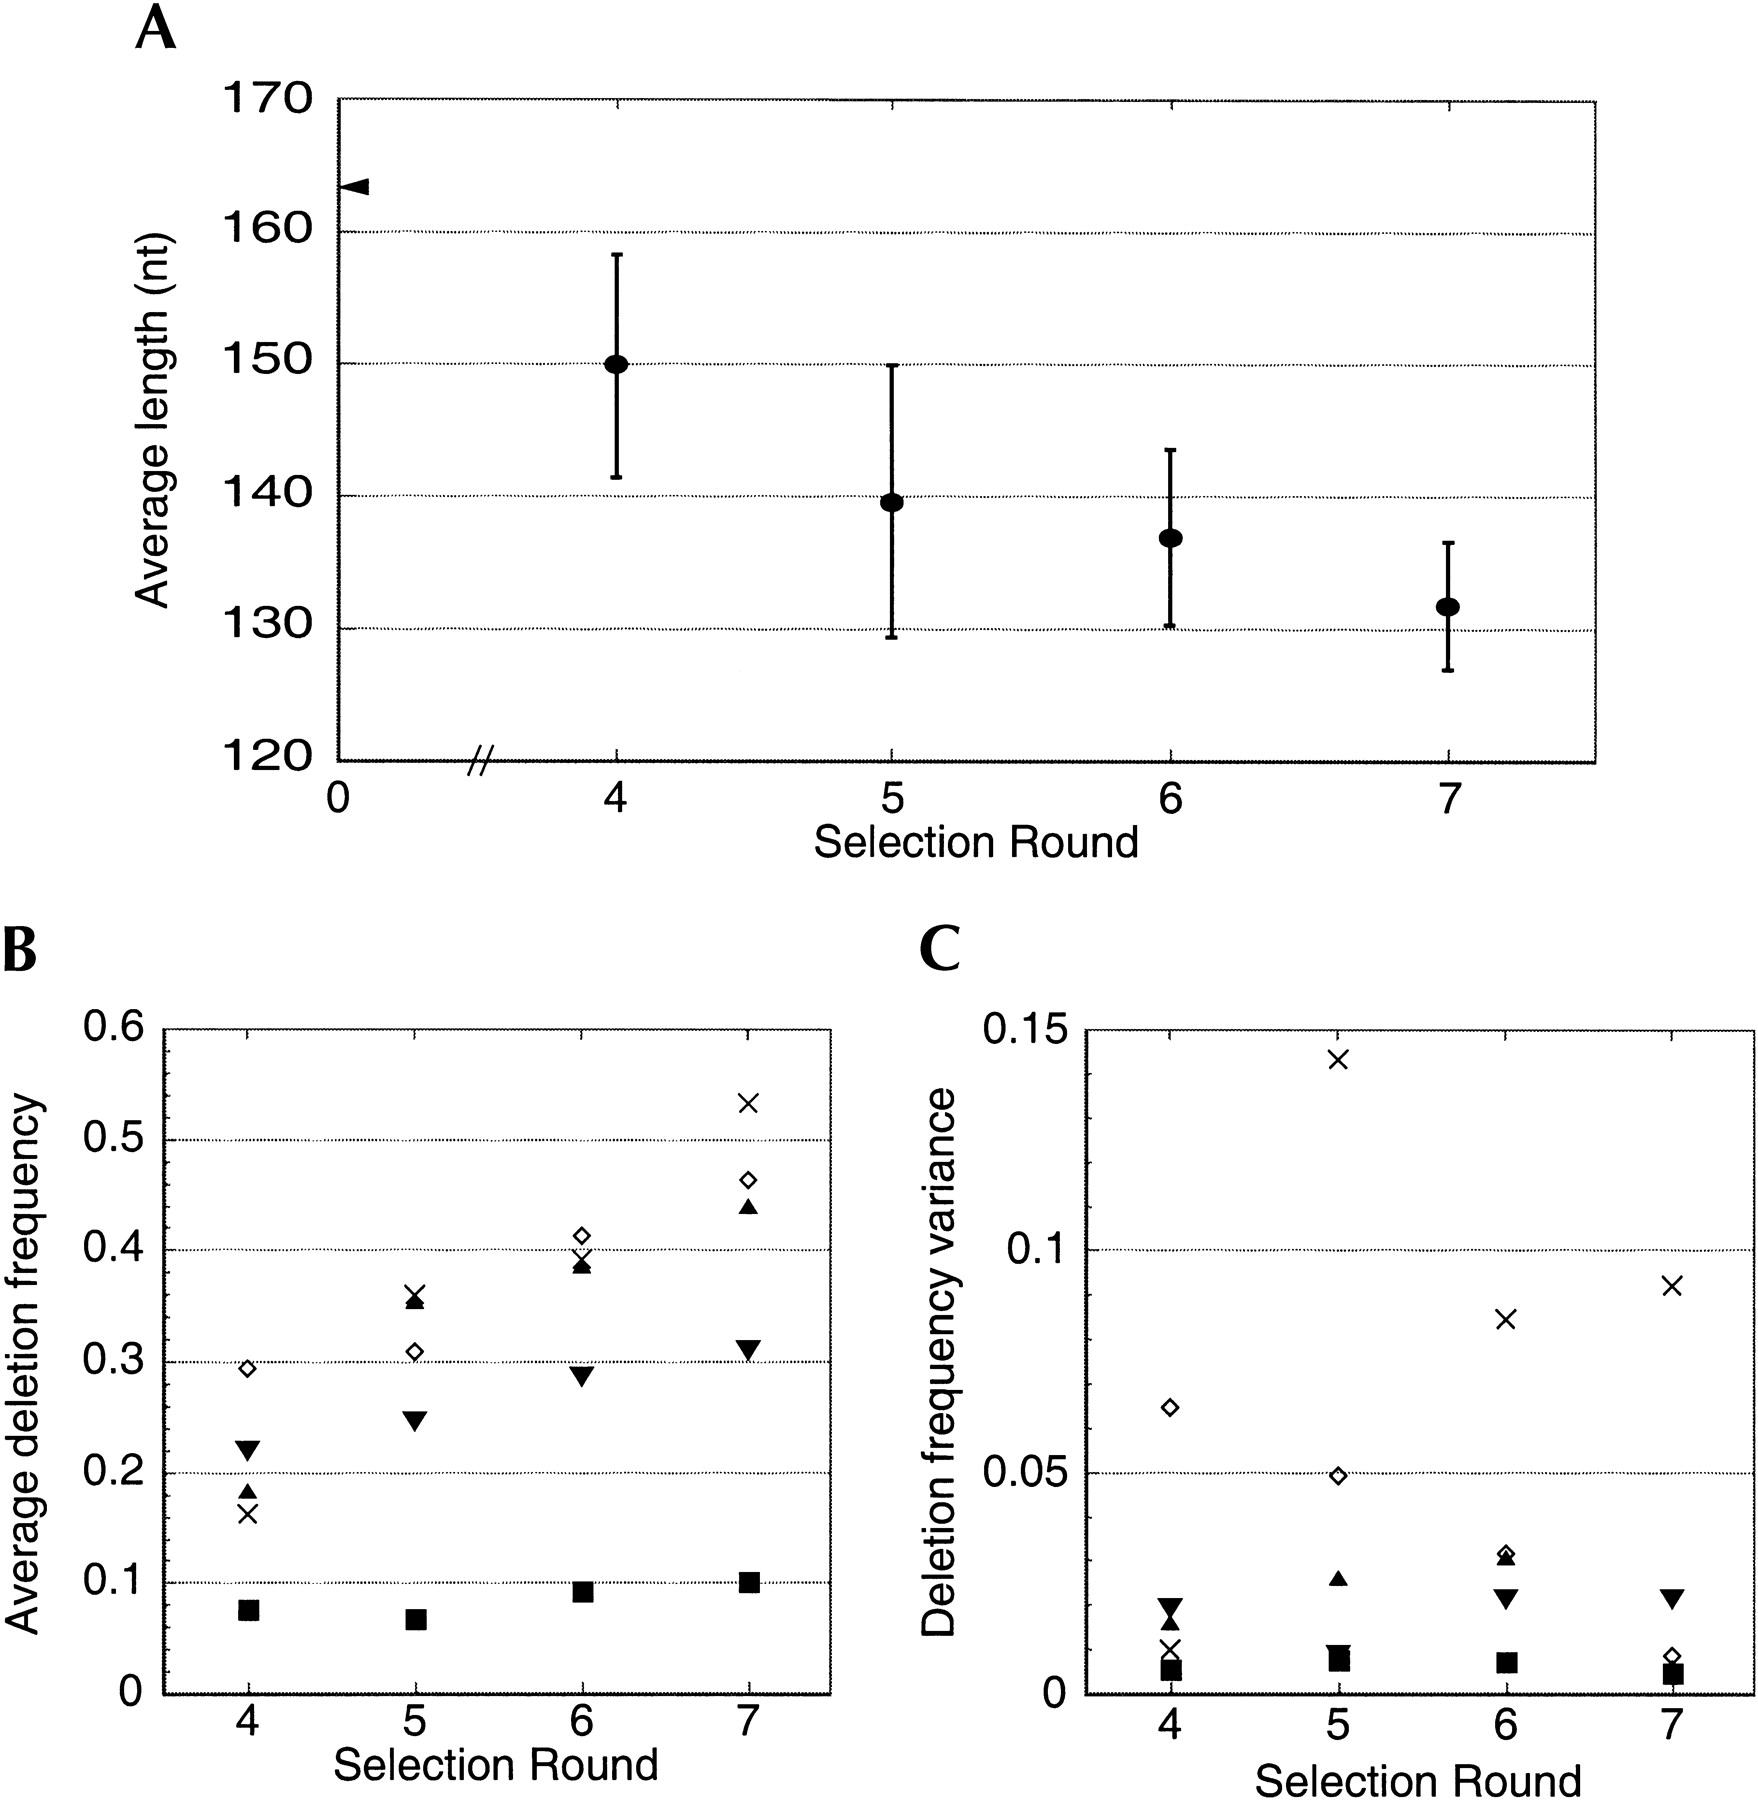
(A) Length of pool molecules with successive rounds of selection from the variable-length pool. Error bars indicate the average and standard deviation of the lengths of cloned ribozymes (n = 17, 19, 20, 20 for rounds 4, 5, 6, and 7 respectively). The length of the RNA sequence template containing no deletions (163 nt) is indicated by the arrow on the vertical axis. (B) Deletion frequencies for each of the five variable regions of isolates shown in Fig. 8 as a function of selection round. (▾) R1; (▴) R2; (⋄) R3; (×) R4; (▪) R5. (C) Deletion frequency variance for each variable region during the deletion selection. R4 has a large variance in part due to the occasional elimination of stem VI during the selection. R3 variance decreases dramatically during the selection, appearing to converge on an optimal solution by round 7. The length of R5 appears to have been nearly optimal since the start of the selection. Symbols as in panel B.




