


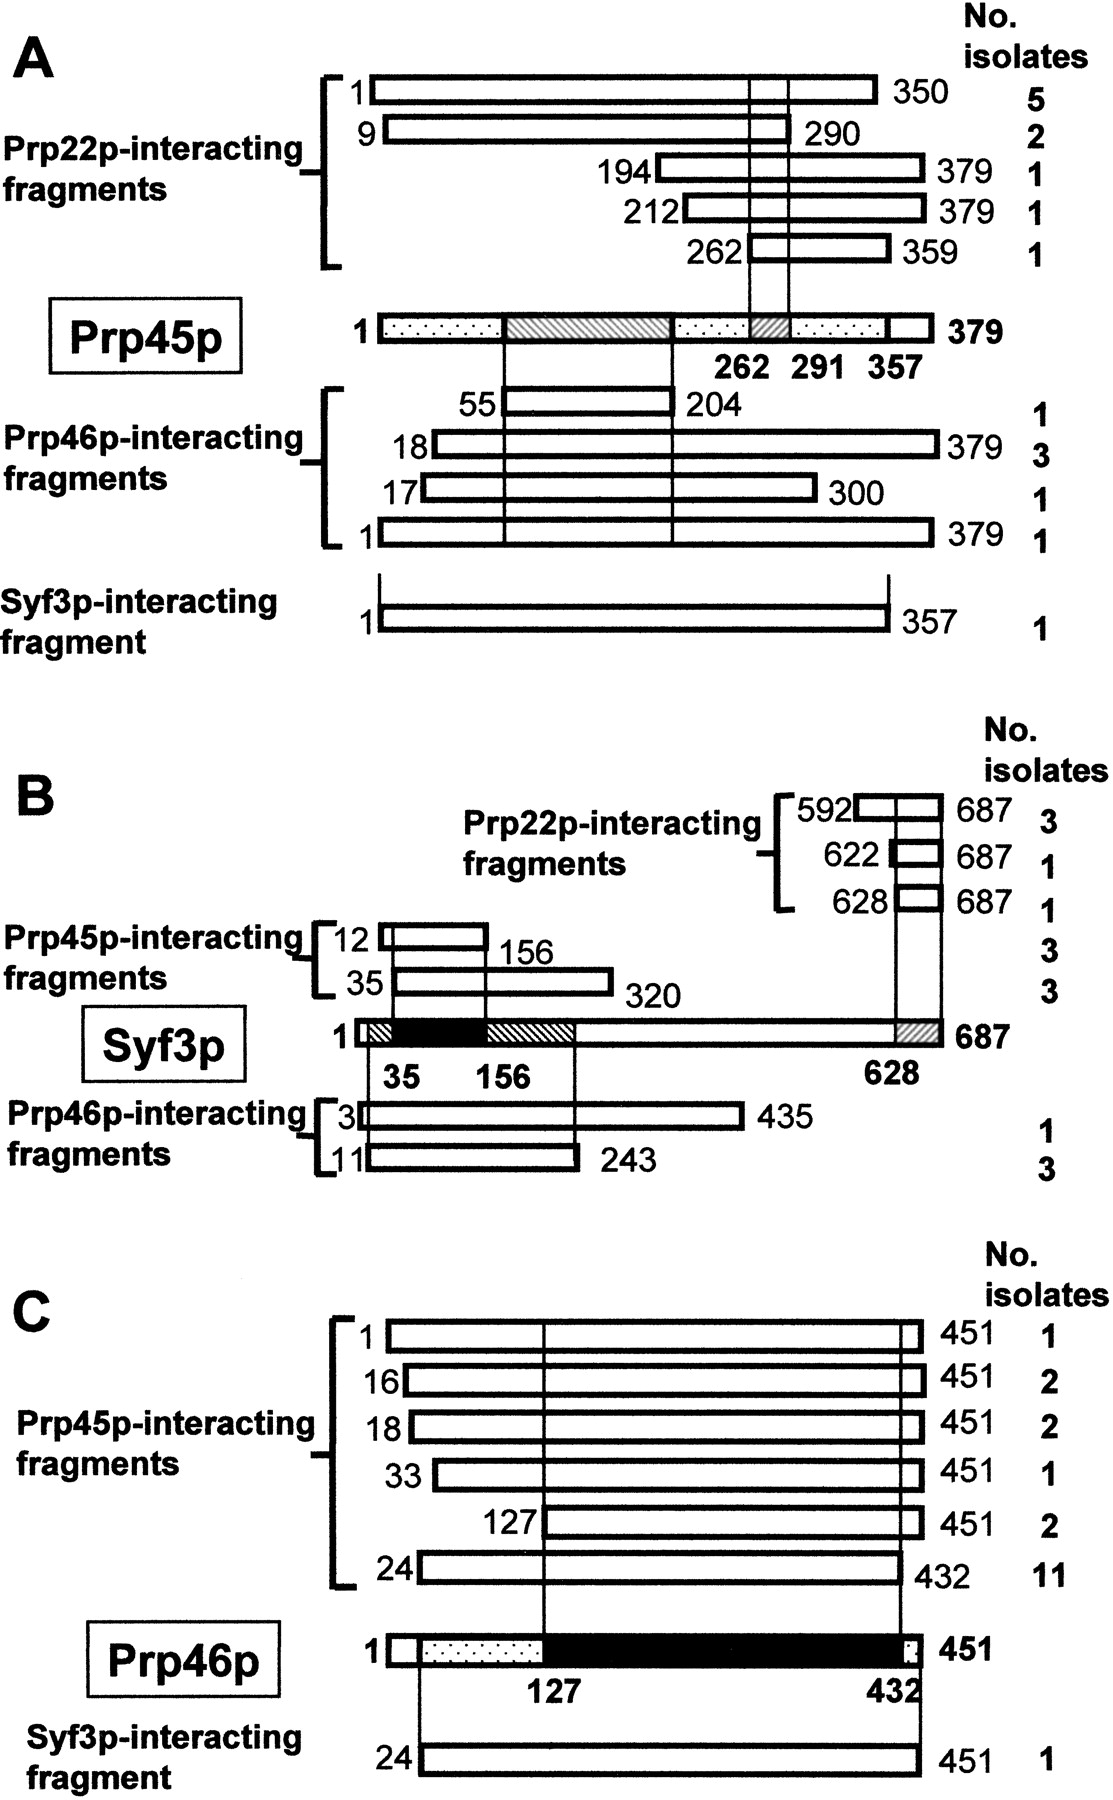
FIGURE 1.
Protein–protein interactions involving Prp45p, Syf3p, and Prp46p. (A) Prp45p; (B) Syf3p; (C) Prp46p. Numbers represent amino acid positions. Vertical lines delineate minimal regions found in common in overlapping prey fusions.




