


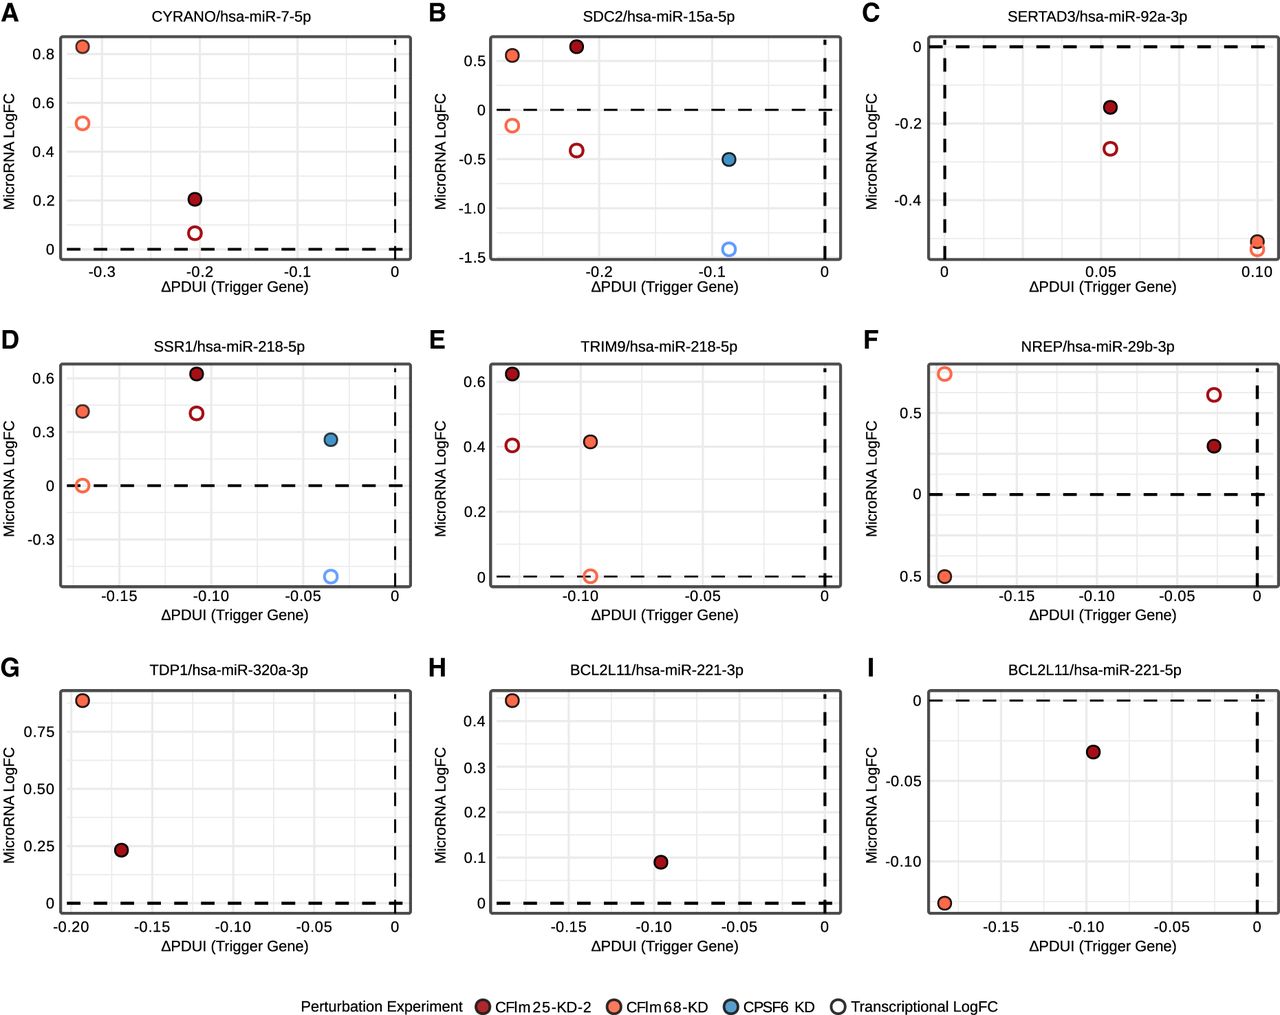
APA-driven 3′UTR shortening of TDMD trigger genes and miRNA abundance changes. Scatter plots relating APA changes of TDMD trigger genes to the log fold change of their paired mature miRNAs across APA-perturbation data sets. Each panel corresponds to one trigger–miRNA pair: (A) CYRANO with hsa-miR-7-5p, (B) SDC2 with hsa-miR-15a-5p, (C) SERTAD3 with hsa-miR-92a-3p, (D) SSR1 with hsa-miR-218-5p, (E) TRIM9 with hsa-miR-218-5p, (F) NREP with hsa-miR-29b-3p, (G) TDP1 with hsa-miR-320a-3p, (H) BCL2L11 with hsa-miR-221-3p, and (I) BCL2L11 with hsa-miR-221-5p (negative control). Filled symbols indicate mature miRNA logFC values predicted by MIRNAPEX, while open symbols represent transcriptional proxy logFC estimates derived from host-gene intronic RNA-seq signal. Points are colored by perturbation data set. The x-axis shows ΔPDUI values (KD − control), with negative values indicating 3′UTR shortening, and the y-axis shows log fold changes.




