


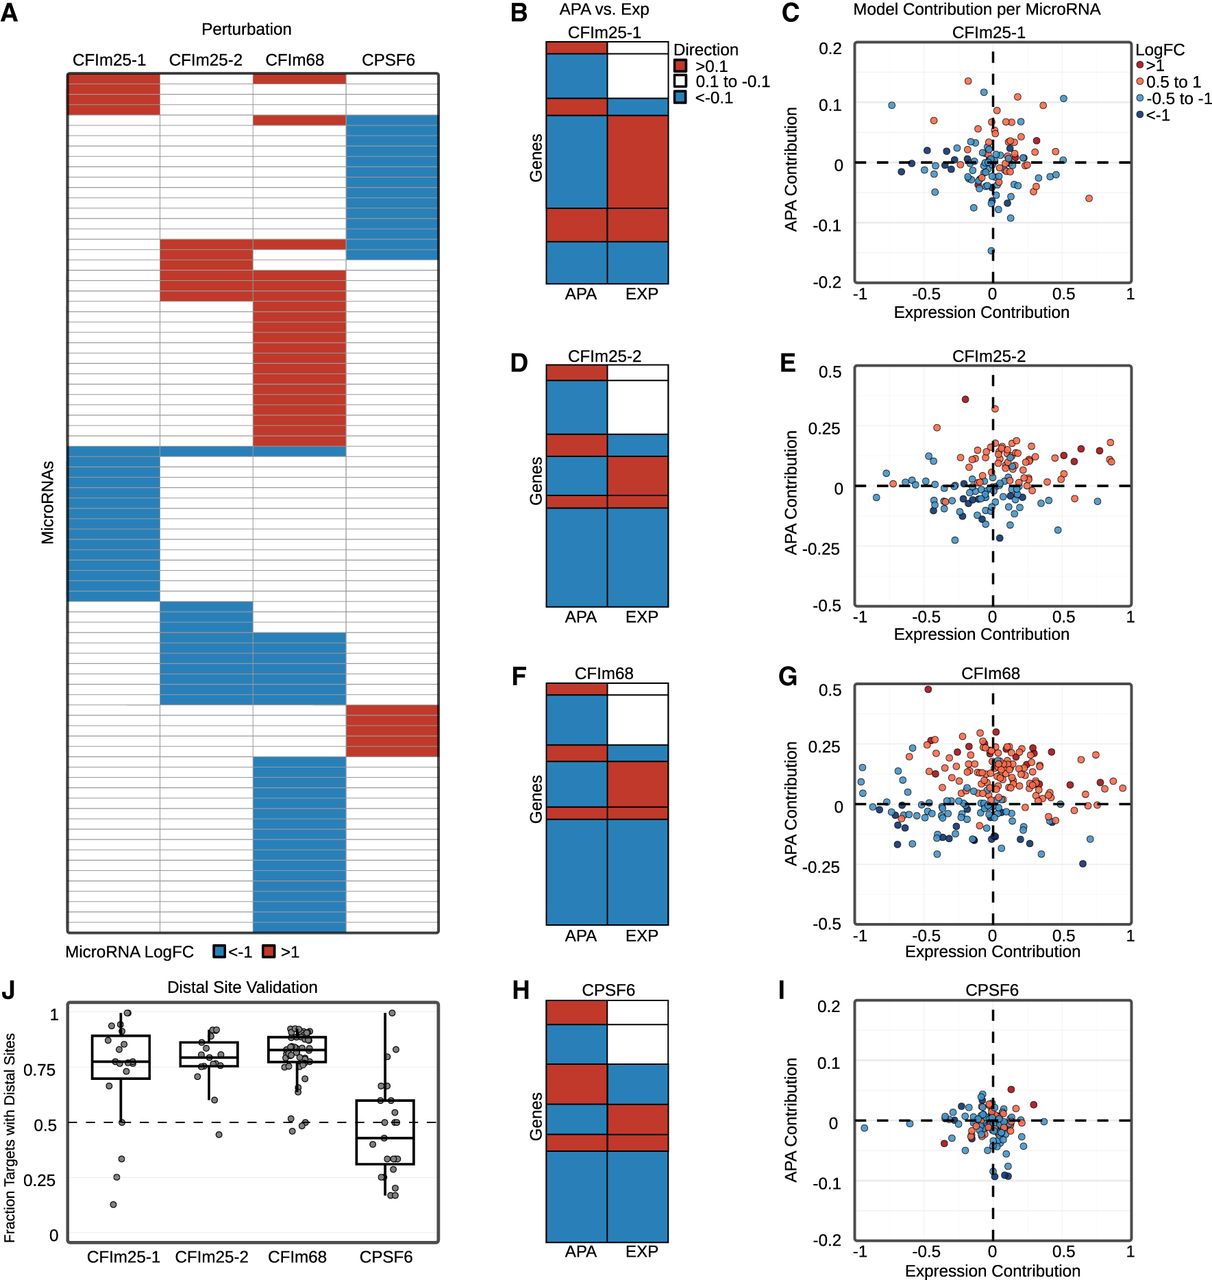
miRNA behavior in APA perturbation experiments. (A) Heat map of MIRNAPEX-computed miRNA logFC across the four knockdown (KD) experiments of APA-regulatory factors (CFIm25-KD-1, CFIm25-KD-2, CFIm68-KD, and CPSF6-KD). Only miRNAs with |logFC| >1 are displayed. (B,D,F,H) Heat maps display, for each gene with an APA change of |ΔPDUI| >0.1, the direction of 3′UTR change (APA column) together with the corresponding gene logFC (EXP column). Lengthening of 3′UTRs or positive gene logFC values are indicated in red, shortening or negative gene logFC values in blue, and no expression change in white. This representation highlights the directionality of APA changes relative to gene expression, showing whether 3′UTR lengthening or shortening coincides with increases or decreases in gene logFC across APA perturbation experiments. (C,E,G,I) Scatter plots show, for each miRNA across the perturbation experiments, the combined (unscaled) contribution of gene expression changes versus APA changes to the predicted miRNA logFC as computed by MIRNAPEX. Points are shaded according to the predicted miRNA logFC values across the defined thresholds. (J) Boxplots showing the proportion of APA-changed target genes that harbor at least one distal binding site for the same miRNA (|logFC| >1) in each perturbation experiment.




